Performance Tracking And Dashboard
Actuals + Forecast
In LivePlan, you can choose to display either forecasted values on their own or combine them with your actual accounting data. This view is available in the Projected Profit & Loss, giving you a clearer, more accurate picture of how your business is performing in real time. You’ll find this feature in the following areas:
Profit & Loss Statement
Revenue Table
Direct Costs Table
Personnel Table
Expenses Table
Blending your actual results with your forecast enables smarter, more agile planning. It provides real-time visibility into your current cash position and profitability, highlights where your performance is on or off track, and supports dynamic updates to your year-end outlook. These insights help to increase your confidence in making adjustments as needed and help keep you aligned with your financial goals and long-term decision making.
This feature is available to LivePlan Premium users. To learn more about LivePlan Premium, please click here.
Choosing Forecast Only or Actuals + Forecast
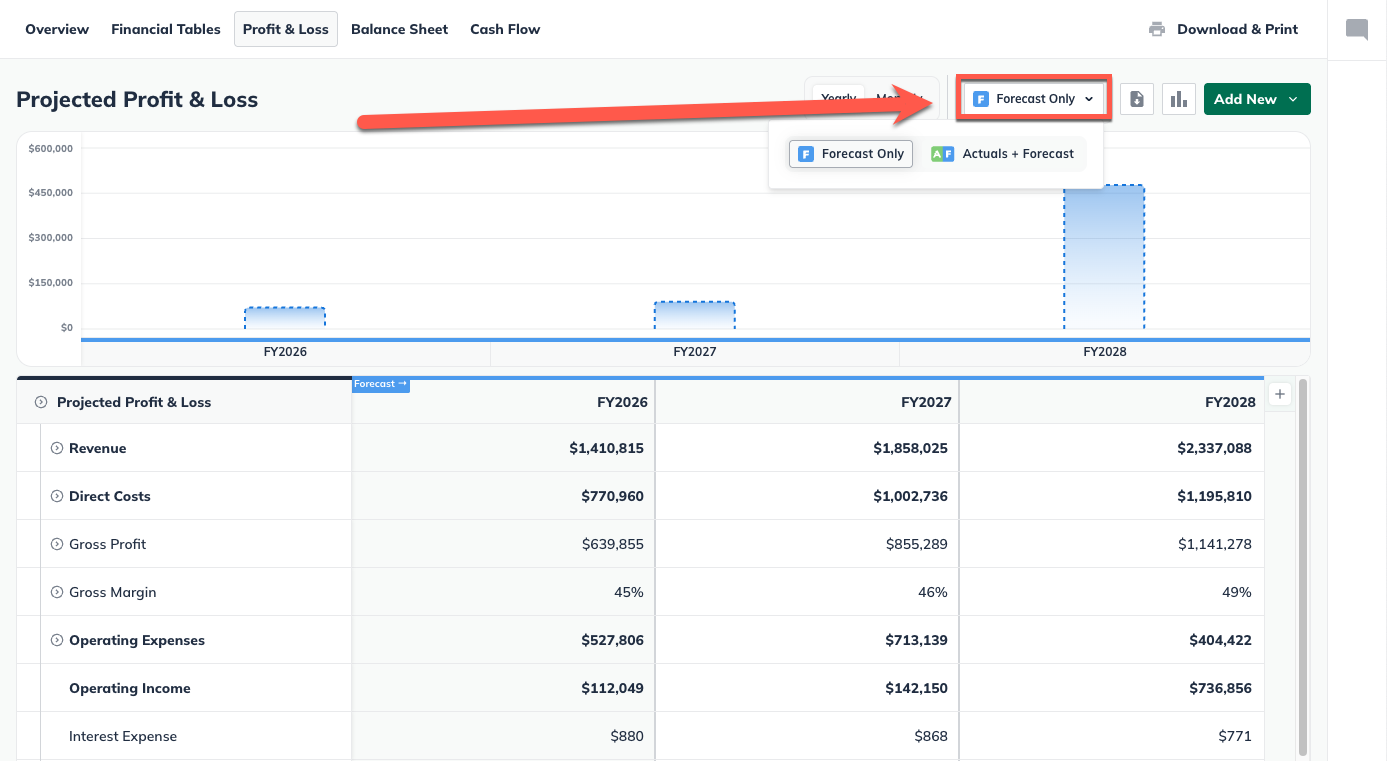
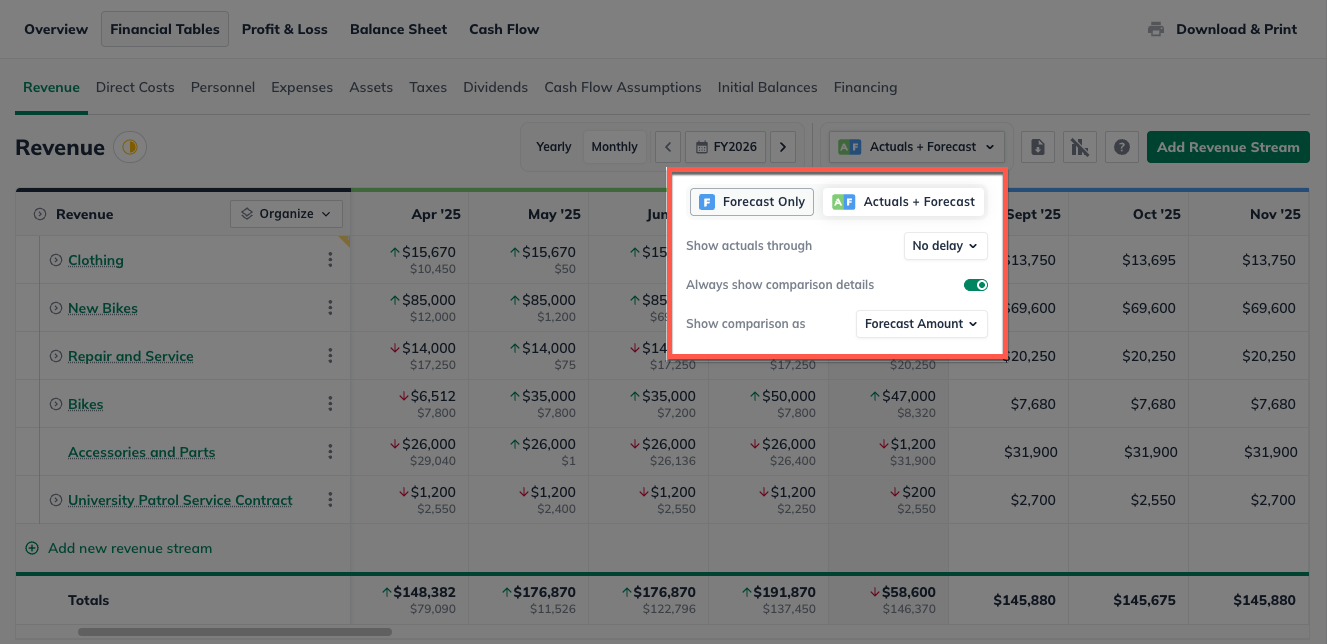
To access this feature, navigate to the Forecast tab, then from there you can open your Profit & Loss. Once there, you’ll see the option to toggle between Forecast Only and Actuals + Forecast.
Forecast Only displays only the forecasted values from your forecast.
Actuals + Forecast overlays your actual accounting data onto the profit and loss statement for completed months, while keeping future months as forecasted values.
Note: Since many businesses don’t close their books immediately at month-end, the most recent month will always display forecasted data, even if actuals are available and you're synced to your accounting solution.
Note: In order to see this feature, you need to either have your LivePlan account connected to Quickbooks Online or Xero, or have actuals entered directly.
When using Actuals + Forecast, you'll also see additional settings appear:
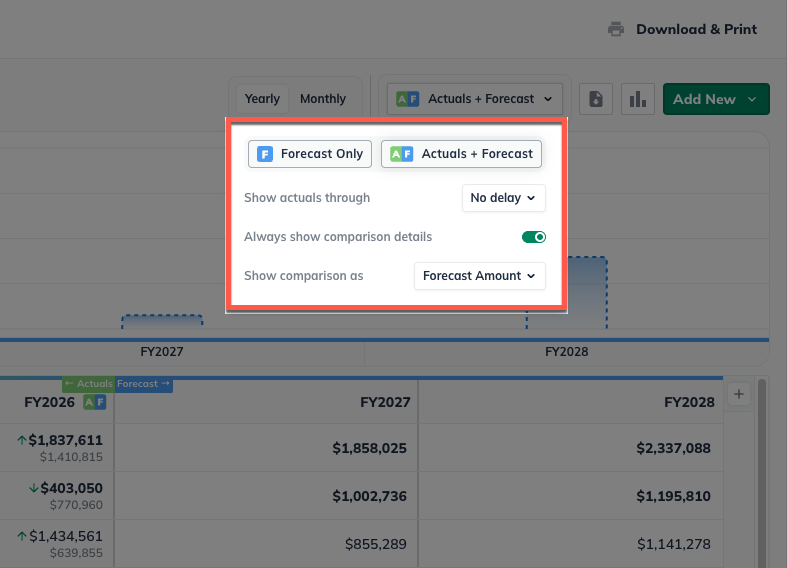
Show actuals through: Choose the most recent month to include actuals for. You can set a delay if your accounting data isn’t fully reconciled yet. For example: If we are currently in May 2025 and I choose the option to show through April 2025, then there will be a 1-month delay in showing actuals in the Forecast.
Always show comparison details: Toggle this on to always show the forecast vs. actual amount difference in the table.
Show comparison as: Choose how to display comparison data:
% Difference
Amount Difference
Forecast Amount
Note: This feature will be visible to contributors with the permission "See actual financial results". To change contributor permissions, refer to "Changing contributor permissions" in your account settings.
How Actuals + Forecast updates your Profit and Loss statement
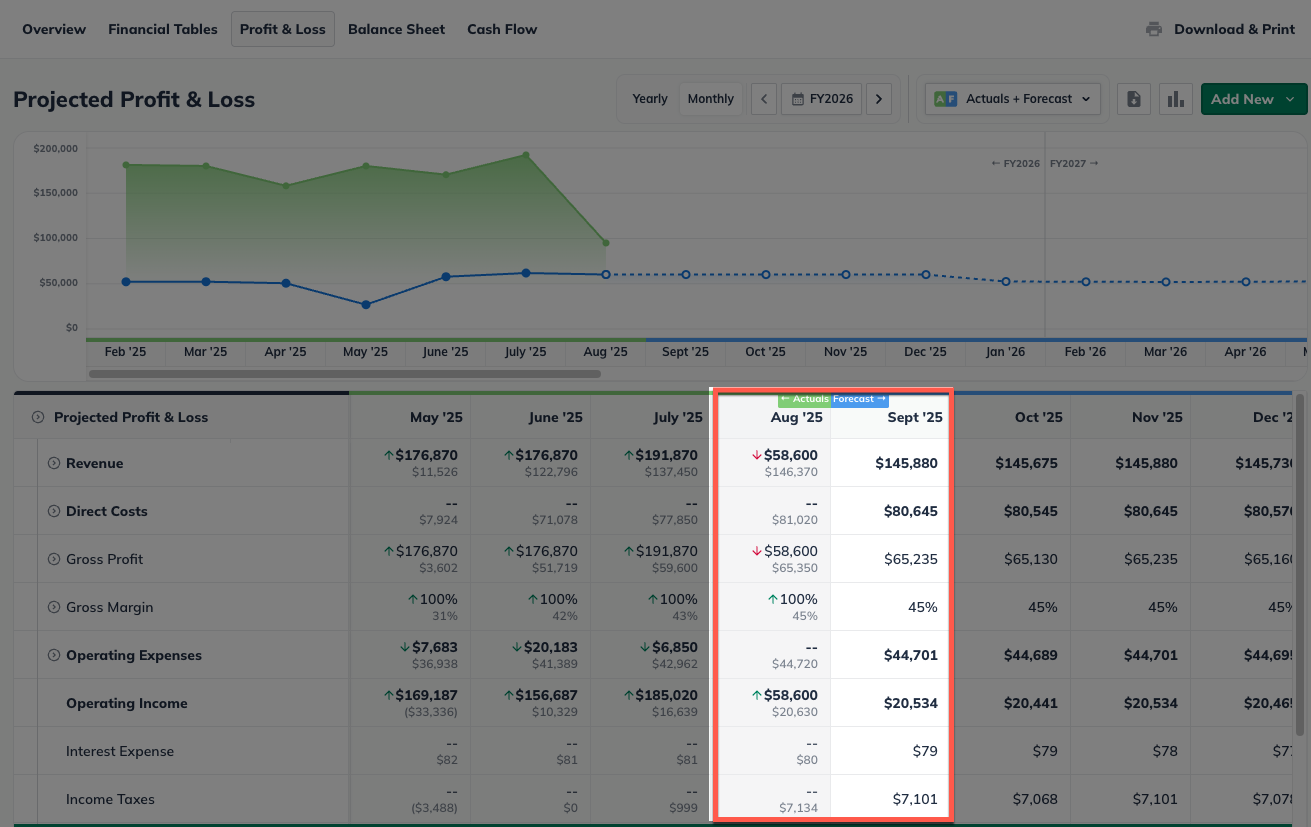
When Actuals + Forecast is selected, past months in your profit and loss statement will display your actual accounting data. This data comes from the Dashboard, either pulled from your connected accounting solution or entered manually.
Any charts at the top of the statement will also be updated:

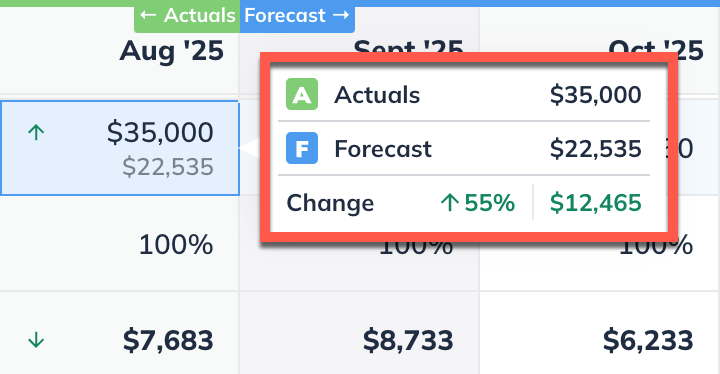
Each past-period column will have a hover state pop-up, that will show you expanded comparison details. This lets you view:
The actual value for that period
The original forecasted value
The difference between them (amount and/or percent, based on your settings)
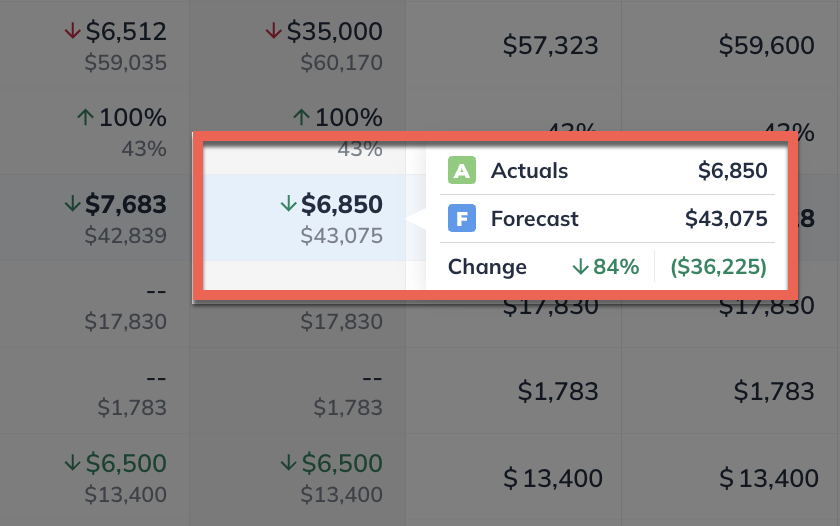
The comparison percentage will include an arrow indicator and color coding to show whether the difference is positive or negative.
Note: LivePlan does not overwrite your forecasted data. Actuals are simply overlaid for comparison purposes and will be removed if you switch back to Forecast Only.
For future periods (for example, a forecasted month), LivePlan will continue to display the forecasted data for that period. For ongoing periods (for example, your current year in progress), LivePlan will display a combination of actuals to date plus the ongoing forecasted values.
Cash Bar on your Profit and Loss Statement
When using Actuals + Forecast, the Profit and Loss statement includes a Cash Bar that shows your current cash balance across time periods.
Past periods use your actual cash balance based on accounting data.
Future periods project your cash balance based on your forecasted net cash changes.
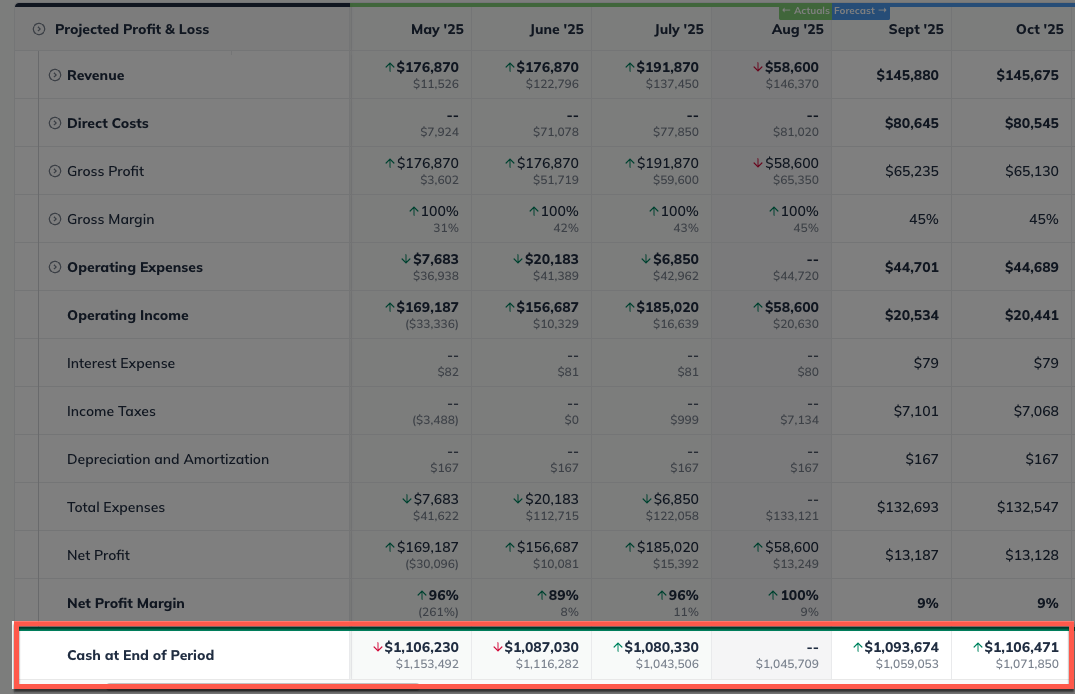
The cash bar gives you an easy way to understand how your forecasted values will impact your current cash.
Note: The cash bar is for on-screen reference only and will not appear in printed versions of your Profit and Loss statement.
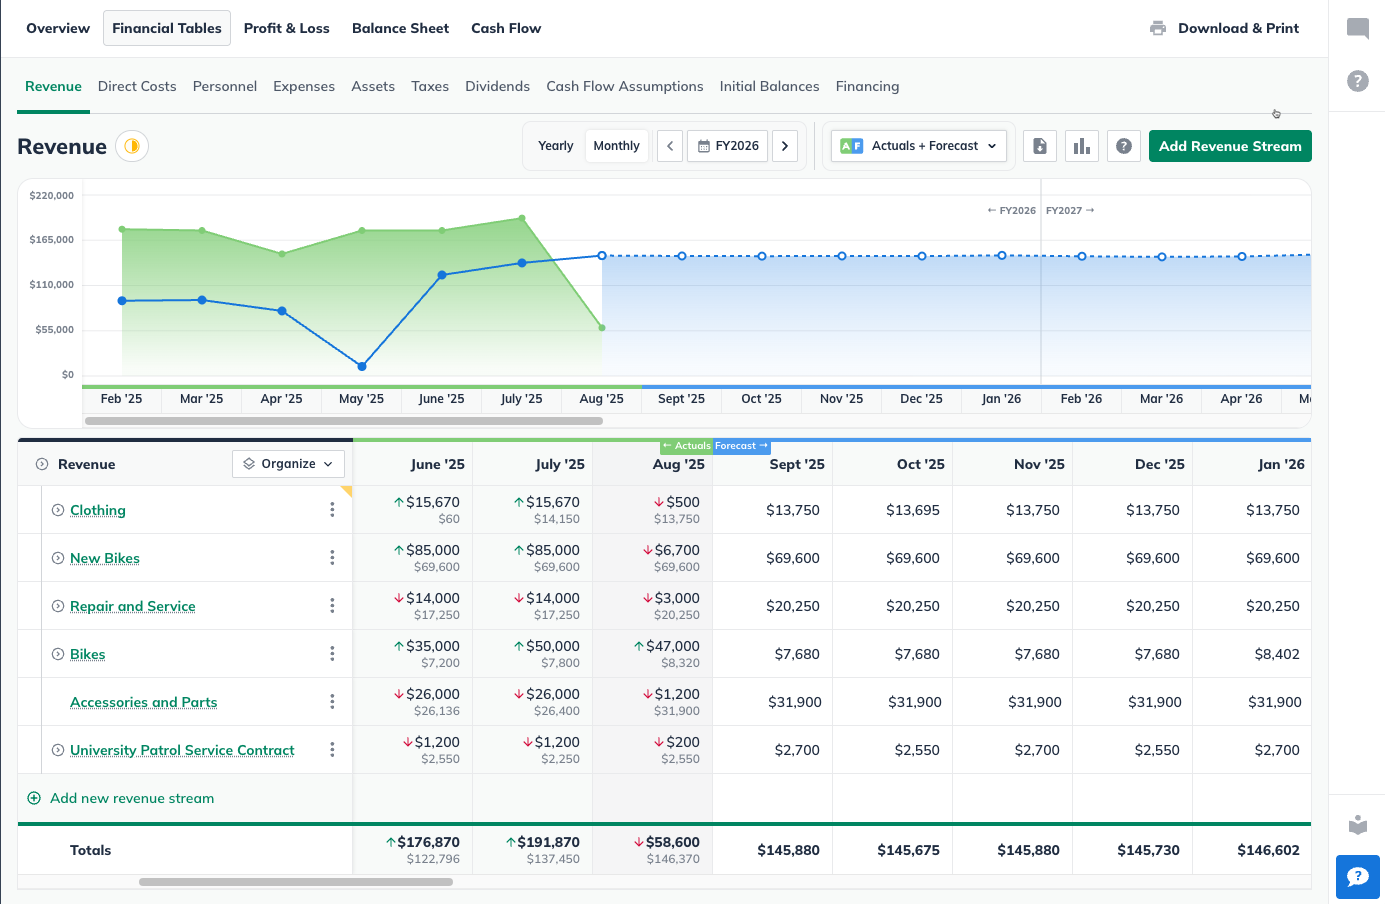
Viewing your actuals in the Financial Tables
Similar to the profit and loss statement above, you can view your actual results alongside your forecasted projections in the Financial Tables section of the forecast.
To access this feature, navigate to the Forecast tab, then from there you will find it in the following financial tables.
Similar to the profit and loss statement, you can choose to display only your forecasted values, or combine them with actual accounting data for a more complete view of your performance.
Forecast Only displays only the forecasted values in the tables and charts in your forecast.
Actuals + Forecast overlays your actual accounting data onto the forecast tables for completed months, while keeping future months as forecasted values.
Any charts at the top of the financial tables will also reflect your chosen setting:
Past periods (based on actuals) are shown in green
Future periods (based on forecast) are shown in blue
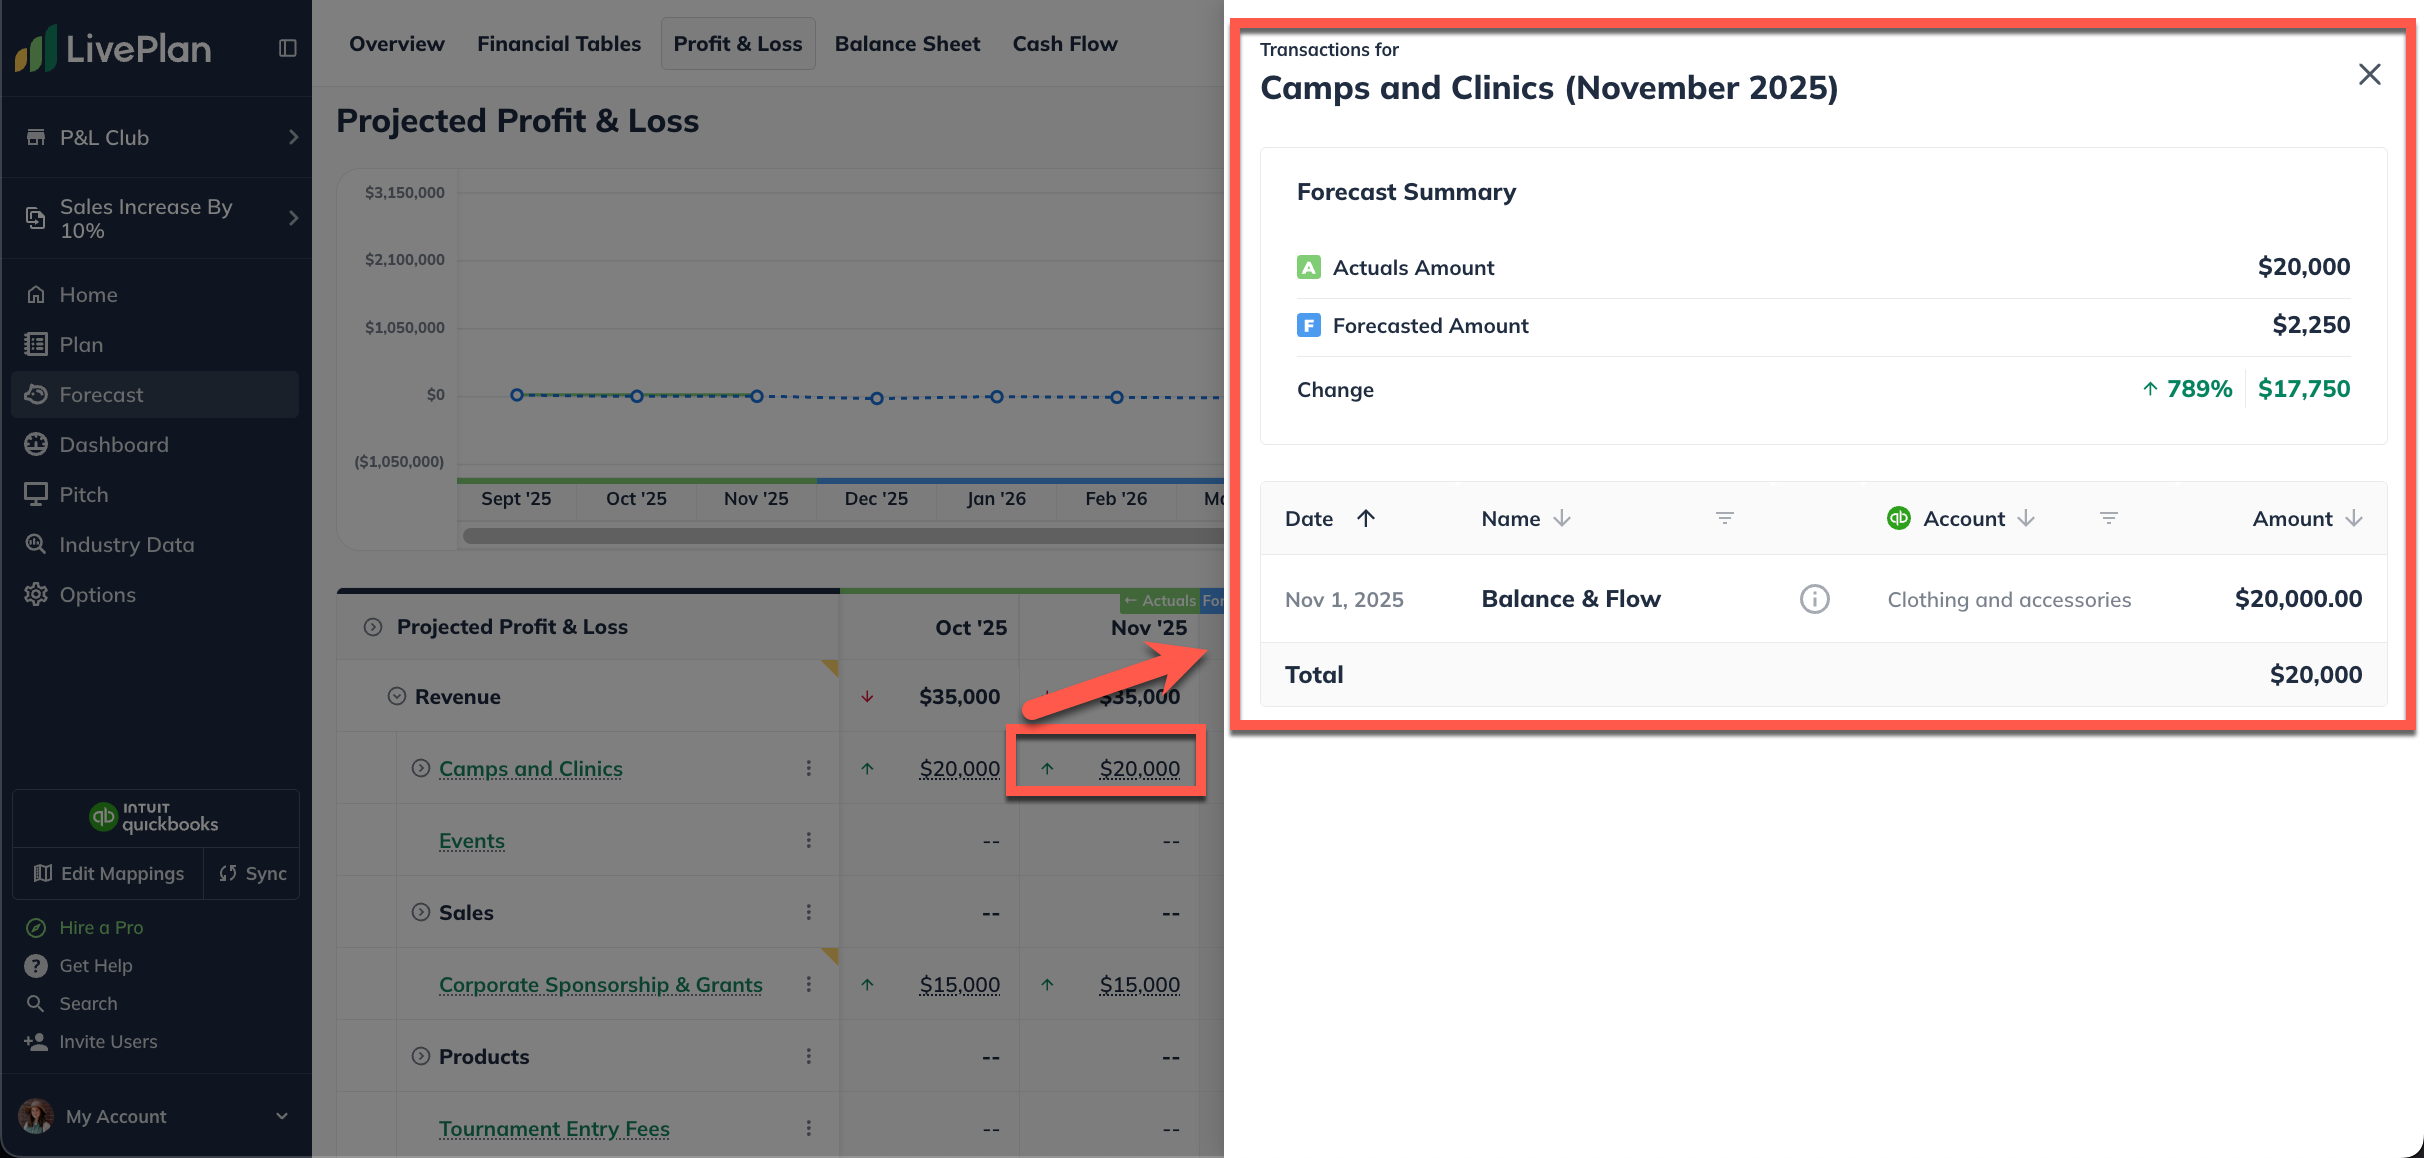
Each past-period column will have a hover state pop-up, that will show you expanded comparison details. This lets you view:
The actual value for that period
The original forecasted value
The difference between them (amount and/or percent, based on your settings)
Clicking on the hover state pop-up will expand a more detailed view of the selection, which if you have a connected Quickbooks Online account, will display data from mapped accounts in your accounting solution.
Note: To learn more about mapping actuals to your forecast, please read - Mapping your accounting solution to LivePlan data