Forecasting Setup And Management
Reading the Cash Flow statement
Reading the Cash Flow statement
A cash flow statement is a record of the increase or decrease in your business's cash balance at any given time. It's a valuable tool for understanding and planning your cash flow. The cash flow statement is a report of changes, not totals. It measures the change in cash during a period. How much money did you start and end with? What changed in between to make it go up or down?
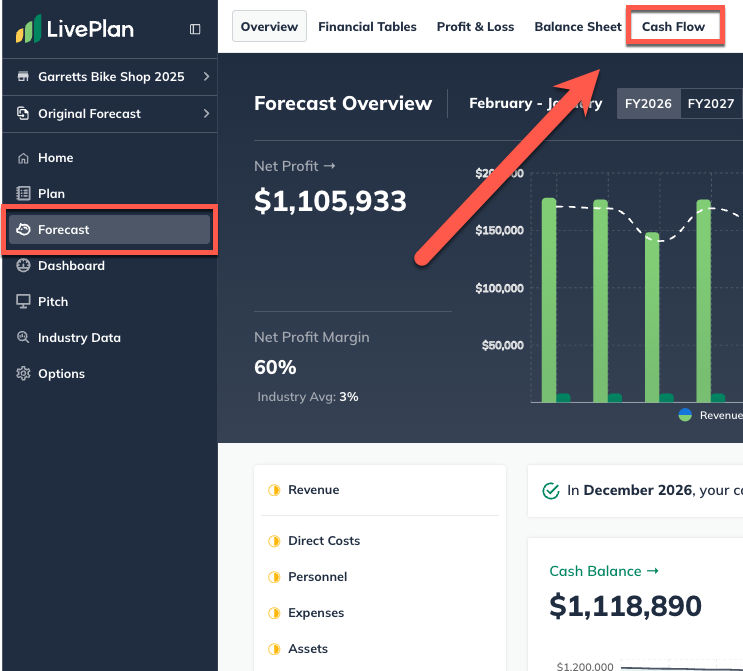
To locate the cash flow statement in LivePlan, click the Forecast section and then select Cash Flow:
Here's a line-by-line explanation of the LivePlan cash flow statement:

Net Cash from Operations
Net Profit - The net profit here is the same as the one in the bottom line of your Profit and loss (P and L) statement. Net profit, or net income or earnings, is your "bottom line." If this number is negative, you’ll know that you are running at a loss. Either your expenses are too high, your revenue is in a slump, or both.
Gain or Loss from Sale of Assets - The gain or loss on the sale of an asset is the difference between the amount of cash your company receives and the asset's book value at the time of the sale. If an asset is set to a depreciation schedule and sold for an amount over or under the linearly depreciated asset value, then that gain or loss will be shown here in the month and year it occurs.
Depreciation and Amortization - This line will only be included if you've added an asset to your forecast. Short-term assets amortize, and long-term assets depreciate. On the profit and loss statement, depreciation is an expense that reduces your net profit. On the cash flow statement, it is added back in as positive cash flow just to offset the fact that the net profit calculation — the starting point for the cash flow statement — has already deducted it.
Change in Accounts Receivable - This line explains how the payment terms you’ve agreed on with your customers affect your cash. It accounts for when you sell a product or service, but your customer doesn't pay you immediately. If this number is negative, your customers owe more than they have paid you, so your cash decreases to account for the money you have not yet received. If this number is positive, your customers have paid you more than they owe, so your cash increases to account for the extra money.
Change in Inventory - If you have inventory management turned on in your forecast, you'll purchase inventory before it is sold. That purchase's effect must be adjusted in the cash flow statement. A negative change in the inventory number means that you have purchased more inventory than you have sold, and a positive change means that you have purchased less inventory than you have sold for that period.
Change in Accounts Payable - Accounts payable refers to money you owe your creditors or suppliers but have not paid yet. If this number is positive, you have incurred more expenses (which were taken out of your net profit) than you have actually paid, so you still have the cash on hand for these expenses. If this number is negative, you have spent more on previous bills owed than you have incurred in new expenses, so you have less cash on hand.
Change in Income/Sales Tax Payable - Any tax you collect and pay to the government affects your cash balance, not your net profit. A positive value means that you have collected more sales tax or VAT from your customers than you have paid to the government, so you have extra cash on hand for that period. A negative value means that you have paid out more sales tax/VAT to the government than you collected from your customers during that period, so you have less cash on hand.
Change in Prepaid Revenue - Deferred income (sometimes known as Prepaid revenue) is money your company has already received for a product or service it has not yet delivered. When you enter a Recurring charges revenue stream into your forecast and set its payments, so you're collecting them every 2 to 12 months, LivePlan will automatically calculate the change in prepaid revenue.
Net Cash from Investing
Assets Purchased or Sold—This line comes from the total assets you have purchased for your business. A negative number represents the cash paid out for purchasing those assets. Note that the purchase of an asset and the source of the cash used to pay for it (such as a loan) are handled separately.
Net Cash from Financing
Investments Received - This line comes directly from any investments you added to the Financing area of the forecast.
Dividends and Distributions - This line represents the total of any dividends you entered into the forecast to represent payments to your investors.
Change in Short-Term Debt/Change in Long-Term Debt - These lines come directly from any loans or custom funding entered into the Financing area of the forecast. They are split out depending on whether the funding is short-term debt (to be paid within 12 months) or long-term debt.
Totaling It All Up
Cash at Beginning of Period - This is the previous period's Cash at End of Period total, carried over.
Net Change in Cash - This is Net Cash Flow from Operations plus Net Cash Flow from Investing and Net Cash Flow from Financing from this period.
Cash at End of Period - This is the Cash at Beginning of Period plus the Net Change in Cash, giving the total amount of cash on hand for this period.
Editing the Cash Flow Statement
LivePlan uses a guided input method of data entry. Unlike a traditional spreadsheet, you do not edit the Cash Flow table directly. Instead, you edit the individual forecast entries that are then calculated and populated into the Cash Flow table.
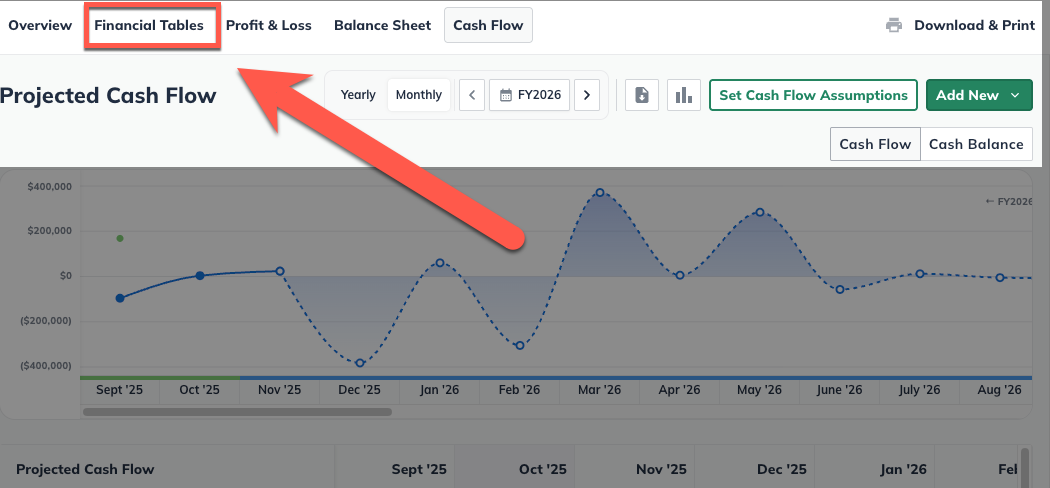
To edit the Cash Flow Statement, click on the Financial Tables section of the forecast in the top menu of the LivePlan Forecast.
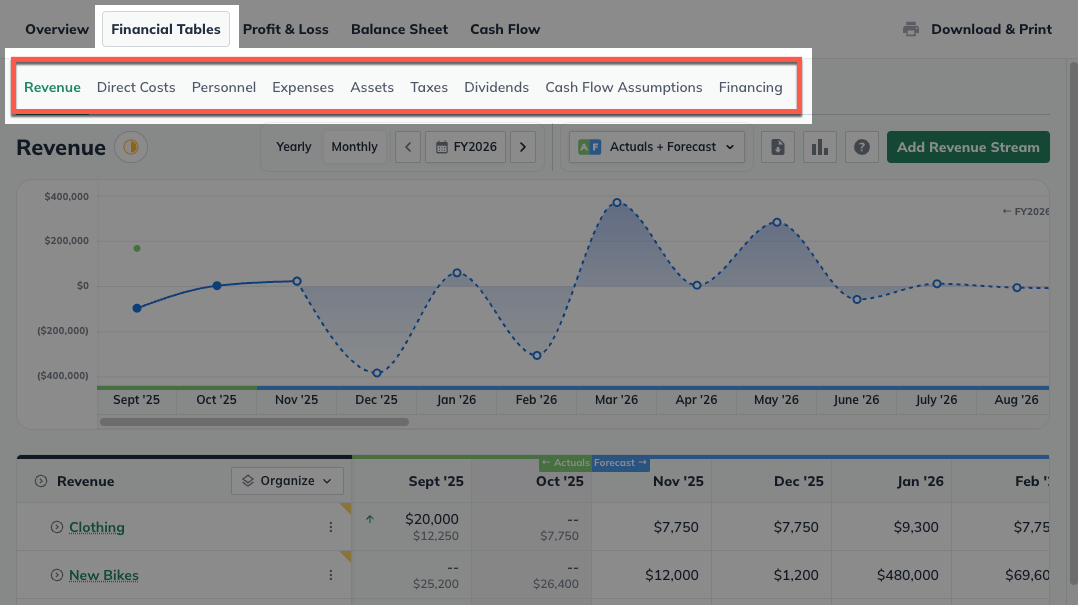
Once in the Financial Tables, select the table corresponding to the entries you need to edit. You can click on any entry to update its contents.
To learn more about how to edit the Cash Flow Statement, please review: How do I edit my financial statements?
What is Cash Flow?
Cash flow is a critical financial metric that tracks the amount of cash entering and leaving a business over a specific time frame. This concept helps business owners and financial analysts understand how well a company manages its cash, indicating its ability to cover expenses, repay debts, and invest in growth opportunities. Cash flow calculations are essentially this simple: Cash Received – Cash Paid Out = Cash Flow
Let's consider a couple of simple examples to explain this concept further:
Example 1: Positive Cash Flow
Imagine a small bakery that, over a month, incurs various expenses such as rent, utilities, and ingredients totaling $4,000. During the same period, it sells baked goods to customers, bringing in $7,000 in cash.
The cash flow for the bakery would be calculated as:
Cash Inflow (Sales Revenue): $7,000
Cash Outflow (Expenses): $4,000
Net Cash Flow: $7,000 - $4,000 = $3,000
In this scenario, the bakery experiences a positive cash flow of $3,000. This means the bakery still has $3,000 left over after paying all its bills. This surplus can be used to invest in the business, save for future expenses, or distribute as profit.
Example 2: Negative Cash Flow
Consider a freelance graphic designer who, in a particular month, spends $2,500 on a new computer, software subscriptions, and office rent but only earns $2,000 from client projects.
The cash flow calculation would look like this:
Cash Inflow (Client Payments): $2,000
Cash Outflow (Expenses): $2,500
Net Cash Flow: $2,000 - $2,500 = ($500)
Here, the graphic designer has a negative cash flow of $500, indicating that they spent more money than they earned. A negative cash flow isn't inherently wrong or bad if it's planned or if the investments made are expected to generate higher income in the future. However, sustained negative cash flow can be a warning sign of financial trouble, possibly leading to liquidity issues.
What do these examples tell us?
These examples show that the cash flow statement is designed to highlight changes, not totals. It quantifies cash flow changes over a period, revealing the starting and ending balances and detailing the factors influencing the rise or decline. This view of future cash is one of the most important things about business planning. It enables you to see whether your plan, if executed well, will produce and maintain a sustainable business. You must also constantly monitor cash flow when your business is running.
Note: None of the lines in the cash flow statement can be edited directly. To edit the cash flow numbers, go to the Forecast section and change your entries there. The cash flow statement will recalculate automatically.
For additional reading about cash flow, we recommend these articles:
Cash Low Point and Cash Depletion Point
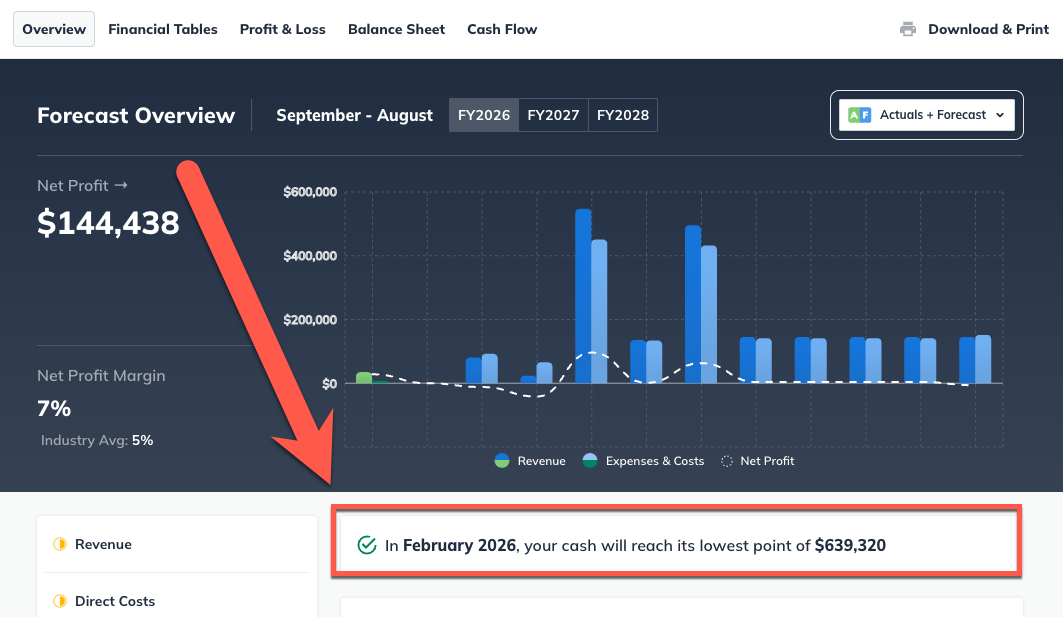
In the LivePlan Forecast Overview, you’ll see a snapshot of your cash position and key operational metrics. This includes an indicator showing either your lowest projected cash balance (if your forecast remains cash positive throughout) or the point at which cash is depleted (if your forecast projects a negative balance).
This cash indicator provides a quick visual reference for whether your business is projected to maintain positive cash reserves or encounter a shortfall. You can use this indicator to identify when and why cash constraints might occur, so you can plan for funding needs, adjust expenses, or fine-tune the timing of key financial activities.
When the Indicator Shows a Cash Low Point
If your forecast remains cash positive throughout, the indicator will display your lowest projected cash balance. This point helps you understand when your available cash will be at its tightest, even if it never goes negative.

You might use this insight to delay large discretionary expenses, build a temporary cash buffer, or align major spending, such as equipment purchases or marketing campaigns with stronger revenue periods.
When the Indicator Shows a Cash Depletion Point
If your forecast shows a period of negative cash flow, the indicator will display the month when your cash is projected to run out.

This can help you plan ahead to secure additional funding, adjust payment terms, or reduce costs before the shortfall occurs. Reviewing this point can also help you test different “what-if” scenarios, such as changing sales assumptions, securing additional funding, or shifting the timing of expenses in order to see how they affect your overall cash position.
If the cash indicator shows an unusually early or inaccurate depletion point, one of the most common causes is an incorrect forecast start date. When the forecast begins several months before your actual financial activity, those empty early months can artificially lower your cash projections. Double-check your forecast start date to ensure it matches your first month of real financial activity.