Writing Your Business Plan
Adding and editing plan charts and tables
Adding a chart or table to your plan
LivePlan includes multiple pre-made charts and tables you can add to any sections within your plan outline.
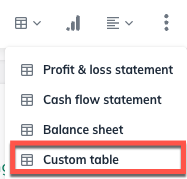
To add a chart or table, select the section you want to add it to.

In the top menu bar, select the chart or table you would like to add to that section. Configure how you would like the chart to display and click Add to Plan:
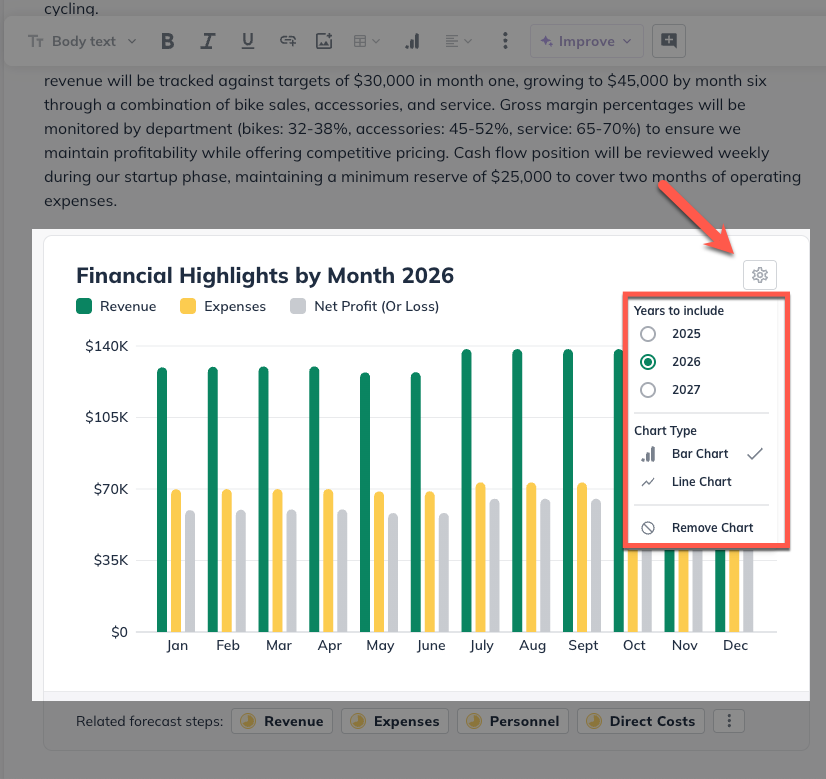
Once in the body of the plan, you can change the configuration of the chart to reflect how you would like it to look upon export.
Note: You can access this function by using the / key command in the body anywhere in the plan sections.
Adding a custom table
You can add tables directly to any topic in your plan to organize information that's easier to read in a structured format. Tables are useful whenever you need to present related details side by side.
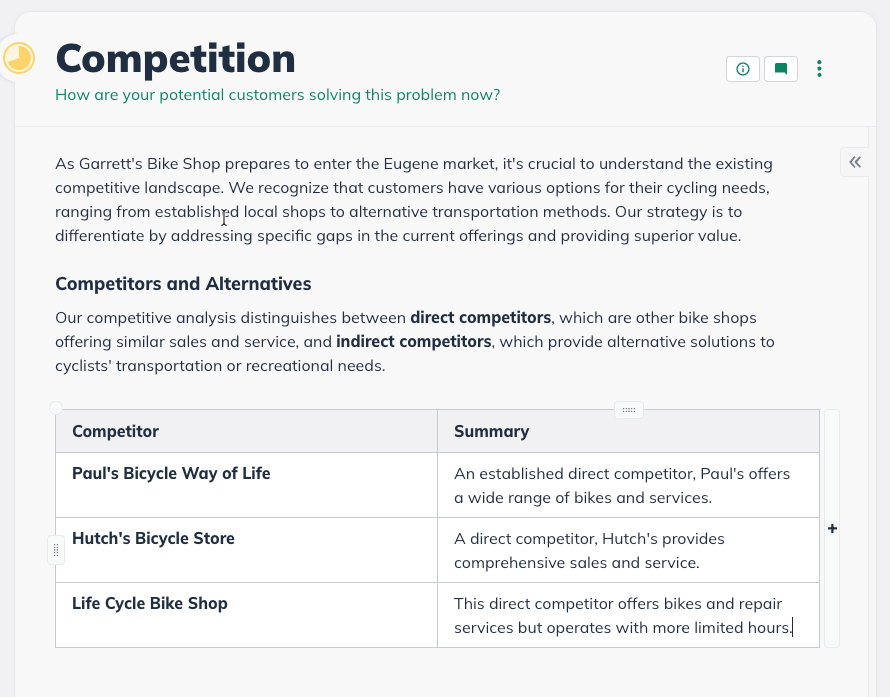
To add a table, click the table icon in the formatting toolbar while editing a plan topic. You can add rows and columns as needed which will automatically resize them to fit your content. Each cell supports text formatting, so you can use bold headers and structure the table to match the level of detail your plan requires.
Tables work well for sections where narrative alone doesn't tell the full story. A competitive analysis is clearer when readers can scan competitors and their strengths in a grid. A staffing plan is easier to follow when roles, responsibilities, and hiring timelines sit in rows. Revenue breakdowns, milestone schedules, and operational comparisons are all good candidates.
Adding a custom chart or table as an image
LivePlan does not support the creation of custom charts. You can only add the pre-built charts that are already available on the Outline page.
If the ability to define your own charts would be valuable to you, please contact us.
Although you can't build custom charts within LivePlan, it is still possible to include them in your plan. To do this, create the chart in Excel or another chart-creation tool and then save it as an image or take a screenshot.
Finally, use the Add an image option in the text editor to insert it into the text:

For more on adding the image to your plan, read Adding and removing images.
Editing a chart or table
You can change a chart or table title but can’t directly edit the data in a LivePlan chart or table. To change the data, you must go back to the forecast area from which the numbers were drawn. For example, to change the Revenue by Month chart data, you need to click the Forecast section and edit the Revenue section of the forecast.
Removing a chart or table
Removing a chart or table from your plan is very simple. You can always add it back to your plan later.
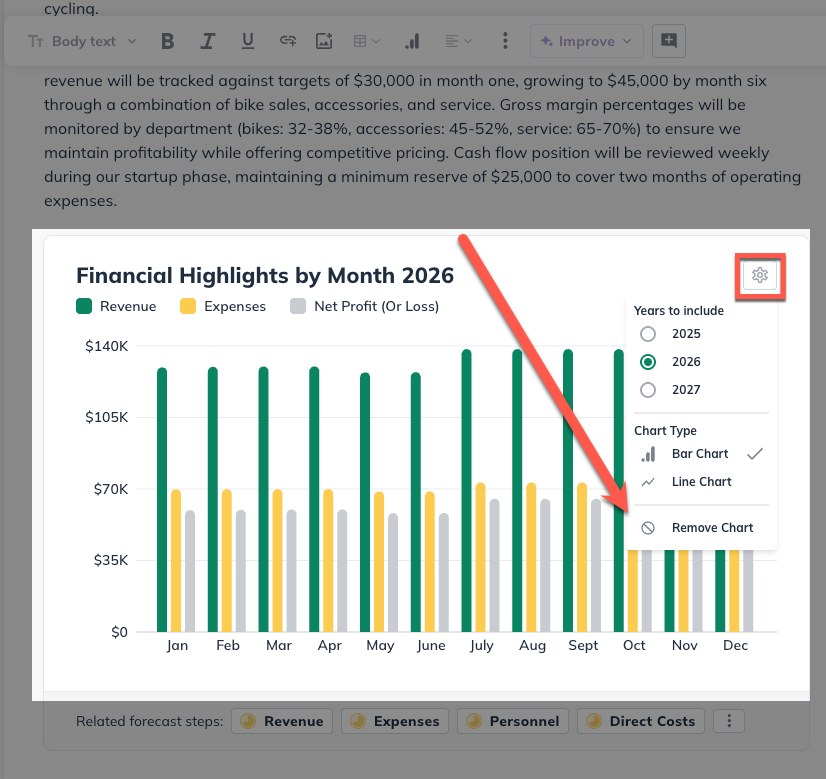
In the Plan section click on the chart you wish to remove
Click the gear icon to configure the chart and select Remove Chart: