Forecasting Setup And Management
Helpful forecast features
We are constantly working on new features that we hope will make your LivePlan forecast easier to use, especially when entering your numbers. We hope that the features below will help you create a great forecast.
Forecast notes
Notes can be posted on any item in the forecast, making it easy to explain forecast assumptions and share ideas between different team members.

You can also click to make Forecast Notes in the title field, individual monthly cells, and annual cells of any item in your forecast. Right-clicking a cell will bring up a list of available actions within that cell.

If a note is made by right-clicking in a forecast cell, the notes toolbar will display a tag with the location of that note in the forecast.

Forecast Commands Toolbar
In the Forecast Commands Toolbar, you can do various quick actions with a given entry.

Add Notes to your forecast: The account owner and any guests or contributors with access to a plan can read and leave notes. Leave notes in LivePlan's Forecast section and comments on any Plan topic. Together, these features help teams collaborate at every step of the planning and review process.
Open the Editor for the selected forecast item: Enter the editor menu to change the settings for the selected forecast item.
Duplicate the selected forecast item: Create a copy of the selected forecast item. This can save time when adding multiple similar entries to your forecast. Click anywhere in the white space of the forecast item cell to bring up the toolbar, then click Duplicate:
Delete the selected forecast item: Click and confirm to permanently delete the selected forecast item.
Customizing your views
The information you've entered is summarized in tables throughout your forecast pages. Here are some helpful features of the table view in the forecast.
Expand or collapse forecast detail: If a table row has items under it, an expand/collapse arrow will appear next to it. Click the arrow to see the related entries underneath:
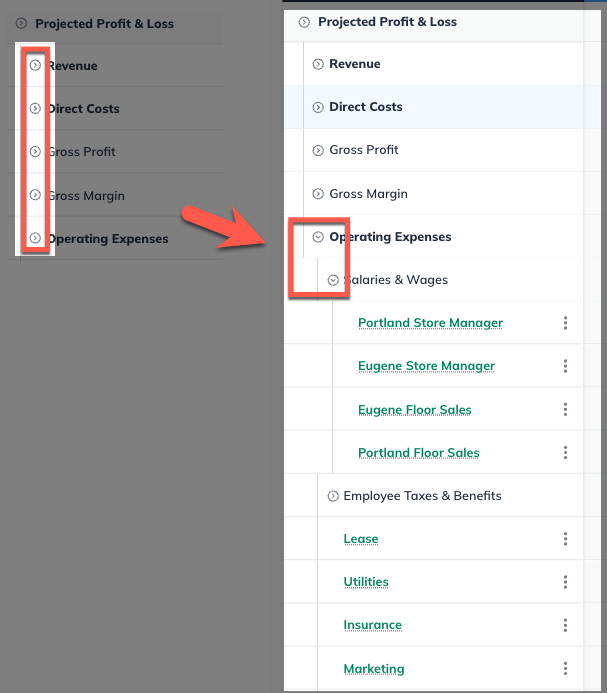
To expand all available table rows, click on the arrow next to the forecast topic heading. Click again to collapse.
In your financial tables, you can create organizational groups that include one or more individual items. Each group is displayed as a parent entry, with the total for the group shown at the parent level and the corresponding subtotals for each item listed beneath it in a nested structure.
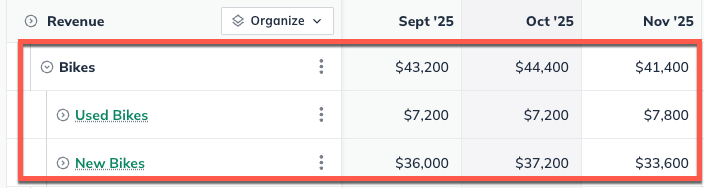
These groups can be expanded by clicking on the expand/collapse arrow that appears next to it.
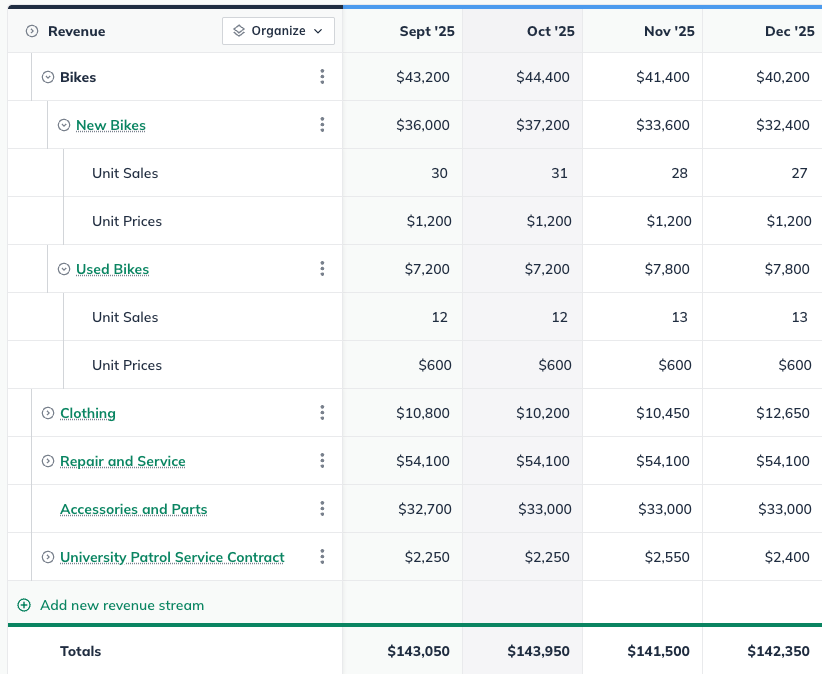
Reordering items in a table: After you've added items to the forecast — revenue streams, direct costs, expenses, etc. — you can change the order in which they appear in the table. To move a row, just click on the drag control to the right of its name and drag it to the new position:

The new position will be indicated by a horizontal line between the rows, and the name of the item you're moving will be shown in a tooltip.

Note that you can only move an item within its assigned group of rows. For example, a revenue stream on the Profit & Loss statement can be moved within the set of revenue streams but not into the set of direct costs.
Existing forecast entries can also be added to a group by selecting Organize at the top left of the financial table and selecting Reorder from the dropdown.
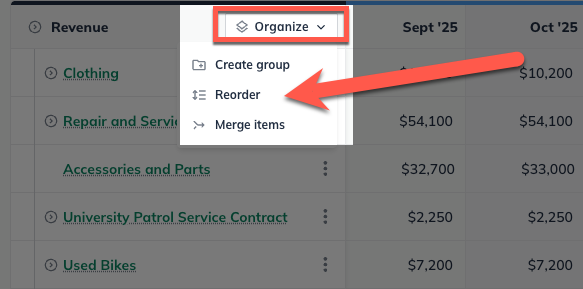
Existing forecast entries can then be dragged and dropped into existing forecast groups in the reordering window.
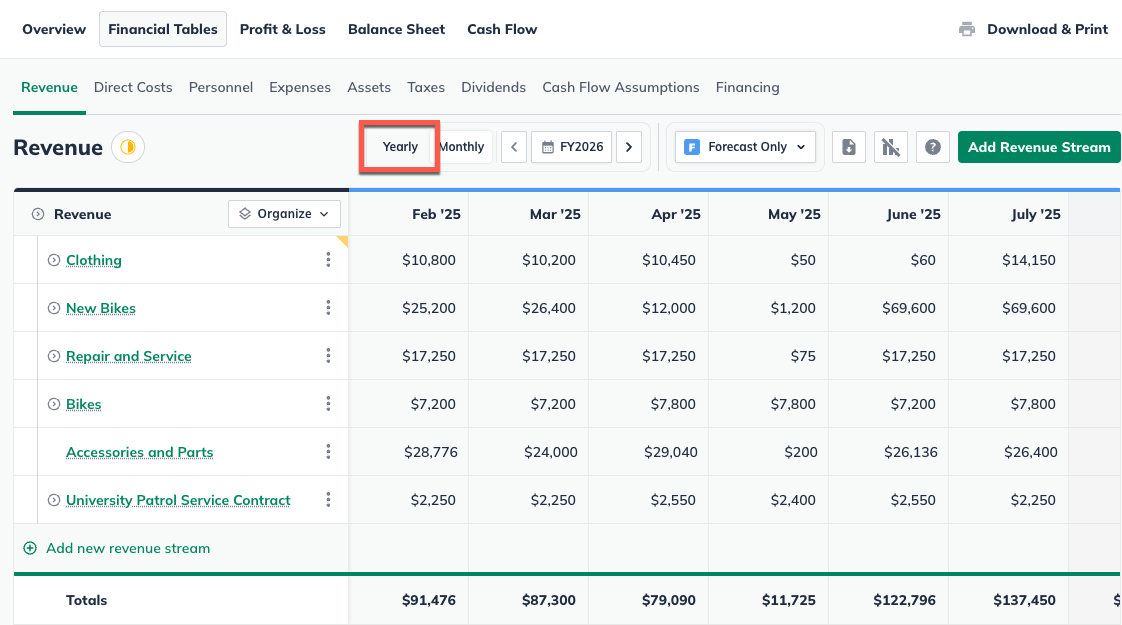
Showing Monthly Details
The Show months button in the top row of the forecast table allows you to choose whether you see annual columns or monthly columns in your forecast tables. This toggle is disabled by default, but you can enable it by clicking the switch. Your choice applies to all your forecast tables, and we save that setting until you change it.
For example, the revenue table shows only annual columns when monthly detail is hidden:

With monthly detail shown, the table shows monthly totals:
Progress Indicators
The Progress Indicator feature in LivePlan allows users to monitor the completion status of various pages within their forecast. This can serve as a checklist for you and your team of contributors and guests, whether you're a pre-revenue business developing a forecast for funding, a start-up planning for growth, or an established business interested in better business management.
This indicator appears across all forecast pages, providing a straightforward overview of each page's status. Progress indicators are also visible via the Plan Outline and Guided Path navigation.

The system automatically updates the progress indicator from “Not Started” to “In Progress” as soon as data is entered into a section. Furthermore, a Forecast Table's status will be marked as “Ready” if a user selects “No” in response to the Forecast Empty State prompt, indicating that a particular Progress Indicator is not required in their forecast.
Users can also manually adjust the status of sections to “In Progress,” “Ready,” or “Needs Review.” This feature is designed to assist users in effectively tracking the progress of their forecast, facilitating better organization and collaboration by clearly indicating which sections need to be started, are currently in progress, require review, or are completed and ready.

Scenarios
LivePlan Premium users can create up to 10 forecast scenarios per plan.
Forecasting varying amounts over time
When creating any forecast entry, you have two options for entering your numbers:

Constant amount, which applies the same number to every month or year of your forecast.
Varying amounts over time, which allows you to manually enter different numbers for each month of your forecast or to have certain months with no numbers at all.
When do I use varying amounts over time?
The Varying amounts over time input is useful in a number of different scenarios:
Let's say you want to show growth in your revenue or growth in your direct costs or expenses as your business grows. In that case, you can use Varying amounts over time to enter larger amounts for each month or year of your plan.
If the unit price of your product or service varies seasonally, Varying amounts over time allows you to set different unit prices for different months.
If you're adding personnel to your forecast and you want to show seasonal fluctuations in the number of staff you'll be employing, Varying amounts over time allows you to enter a different number of employees each month. You can also use this method to show seasonal fluctuations in salary amounts.

In other words, the Varying amounts input can be used throughout the forecast, adding flexibility to your projections.
Inline editing in the forecast
Line entries that have been entered using the varying amounts over time can also be edited more directly in the Forecast’s Table View using inline editing. To use the inline editing you’ll need to expand your forecast entries so that you can access the editable portions of the entry. When you hover your mouse over the figures you’ll see a smaller inner box highlight the figures that can be changed.

Please note that you’ll only be able to inline edit the values that have been input using the varying amounts over time entry method.
Percentage Growth Rates
Applying an overall percentage of growth to the forecast
In the Varying amounts input mode, you can also apply a flat percentage of growth to each month of the current forecast year by entering a number in the Change field and clicking Apply:

Applying an annual percentage of growth to varying amounts entries
When you've created an entry using varying amounts over time, you can then apply a flat growth percentage to each month of the current year. Enter the percentage in the Change field, and click Apply:
As shown above, the numbers entered will both change as the percentage is applied to all months of the current year.
Calculate formulas within cells
LivePlan's Forecast section can calculate simple mathematical formulas within cells. This feature is useful for making quick calculations without having to divert your attention away from the forecast and can be performed from any cell within your LivePlan forecast. Addition and subtraction use the + and - characters, / (backslash) divides, and * (asterisk) multiplies.
In the example pictured below, the formula 115.50*38 has been entered in the cell:

Click anywhere outside of the cell to solve the formula:

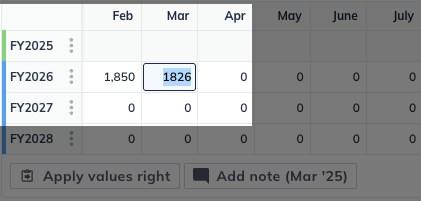
This feature works in the varying amounts over time entry method as well. In the following example, 897+929 is entered into one of the cells.
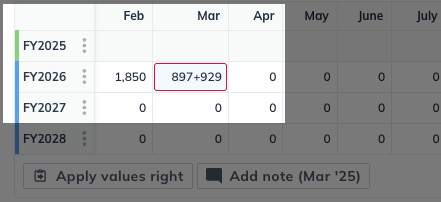
Clicking outside of the cell solves the formula:
Swap direct costs and expenses
If you have created a line entry for a direct cost or expense and need to move it between those two categories, you can move the line item from one page in the Forecast to another using the Change Item option.
Expense to Direct cost
From the Forecast section, go to the Expenses page
Click the box of the line entry that you’d like to move
Select Change Item from the menu that appears at the bottom of the screen
Then Confirm the change
You’ll see that the line entry is now on the Direct Costs page of your forecast and can be edited and adjusted there.

Direct Cost to Expense
From the Forecast section, go to the Direct Costs page
Click the box of the line entry that you’d like to move
Select Change Item from the menu that appears at the bottom of the screen
Then Confirm the change
You’ll see that the line entry is now on the Expenses page of your forecast and can be edited and adjusted there.
