Forecasting Setup And Management
Organizing the tables in your forecast
Re-ordering items in your forecast tables
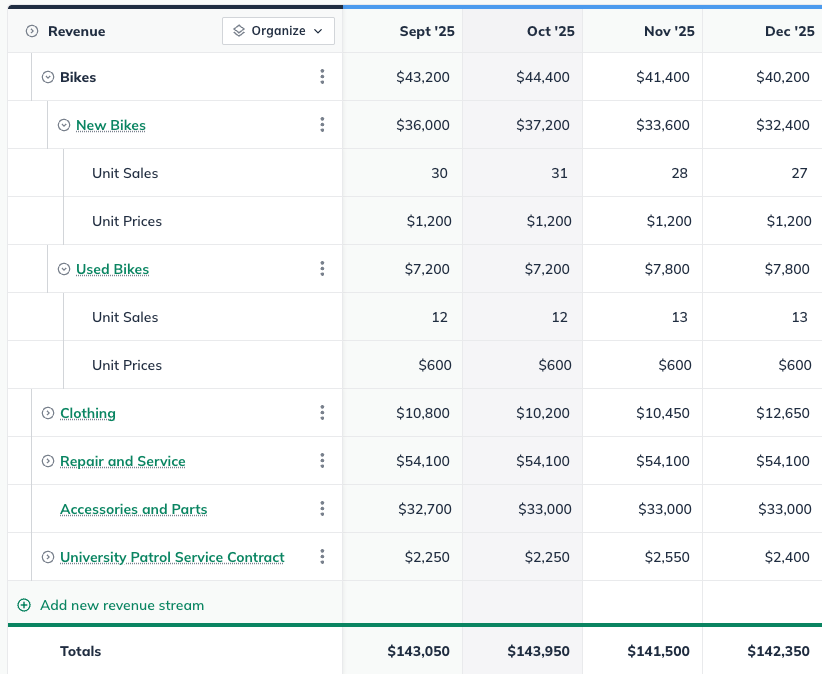
After you've added items to the forecast — revenue streams, direct costs, expenses, etc. — you can change the order in which they appear in the table. You can change the order of items on the individual pages, like Revenue, Direct Costs, Expenses, etc. You can also re-order items listed on the Profit and Loss statement.
To move a row, just click on the drag control to the left of its name and drag it to the new position:

Note: You can only move an item within its assigned group of rows. For example, a revenue stream on the Profit & Loss statement can be moved within the set of revenue streams but not into the set of direct costs.
A horizontal line between the rows will indicate the new position, and the name of the item you're moving will be shown in a tooltip.
Existing forecast entries can also be added to a group by selecting Organize at the top left of the financial table and selecting Reorder from the dropdown.
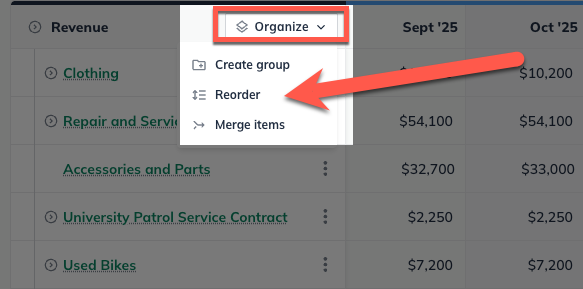
Existing forecast entries can then be dragged and dropped into existing forecast groups in the reordering window.
Expanding and collapsing sections of forecast tables
In many of the tables that display in the Forecast section, you have the option to expand some lines in order to see more detail, or collapse these lines to simplify the display.
Note: Expanding and collapsing will only affect the screen display of a table. It doesn't change the way the table downloads or prints.
Any line in a table that has a small triangle icon to the left is an expandable line:
Clicking on that triangle icon will expand or collapse the line as shown below:
If you click the triangle at the top row of a table, you can expand and collapse all lines simultaneously:
You'll find expandable lines in the following forecast tables:
Forecast Groups
In your financial tables, you can create organizational groups that include one or more individual items. Each group is displayed as a parent entry, with the total for the group shown at the parent level and the corresponding subtotals for each item listed beneath it in a nested structure.
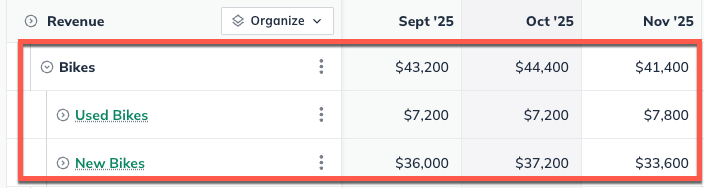
These groups can be expanded by clicking on the expand/collapse arrow that appears next to it.