Performance Tracking And Dashboard
Metrics and ratios available on the LivePlan Dashboard
Top metrics Key margins Cash metrics Money due in/out Spending metrics Productivity metrics Assets & liabilities
Once you've connected LivePlan to your accounting solution and imported your actuals (or entered them directly), the Dashboard section will give you a useful set of performance metrics. This data helps you track the health of your business over time.
This feature is available to LivePlan Premium users. To learn more about LivePlan Premium, please click here.
The metrics offered in the Dashboard will focus on the financial performance of your company - financial metrics are helpful indicators for any type of business.
These Dashboard metrics may not be the only metrics you need. Every business is different, so every business will need to watch different numbers, based on the needs of its industry and market.
Here's a complete list of the metrics available on the LivePlan Dashboard, presented in the order they're displayed in the Trends menu:
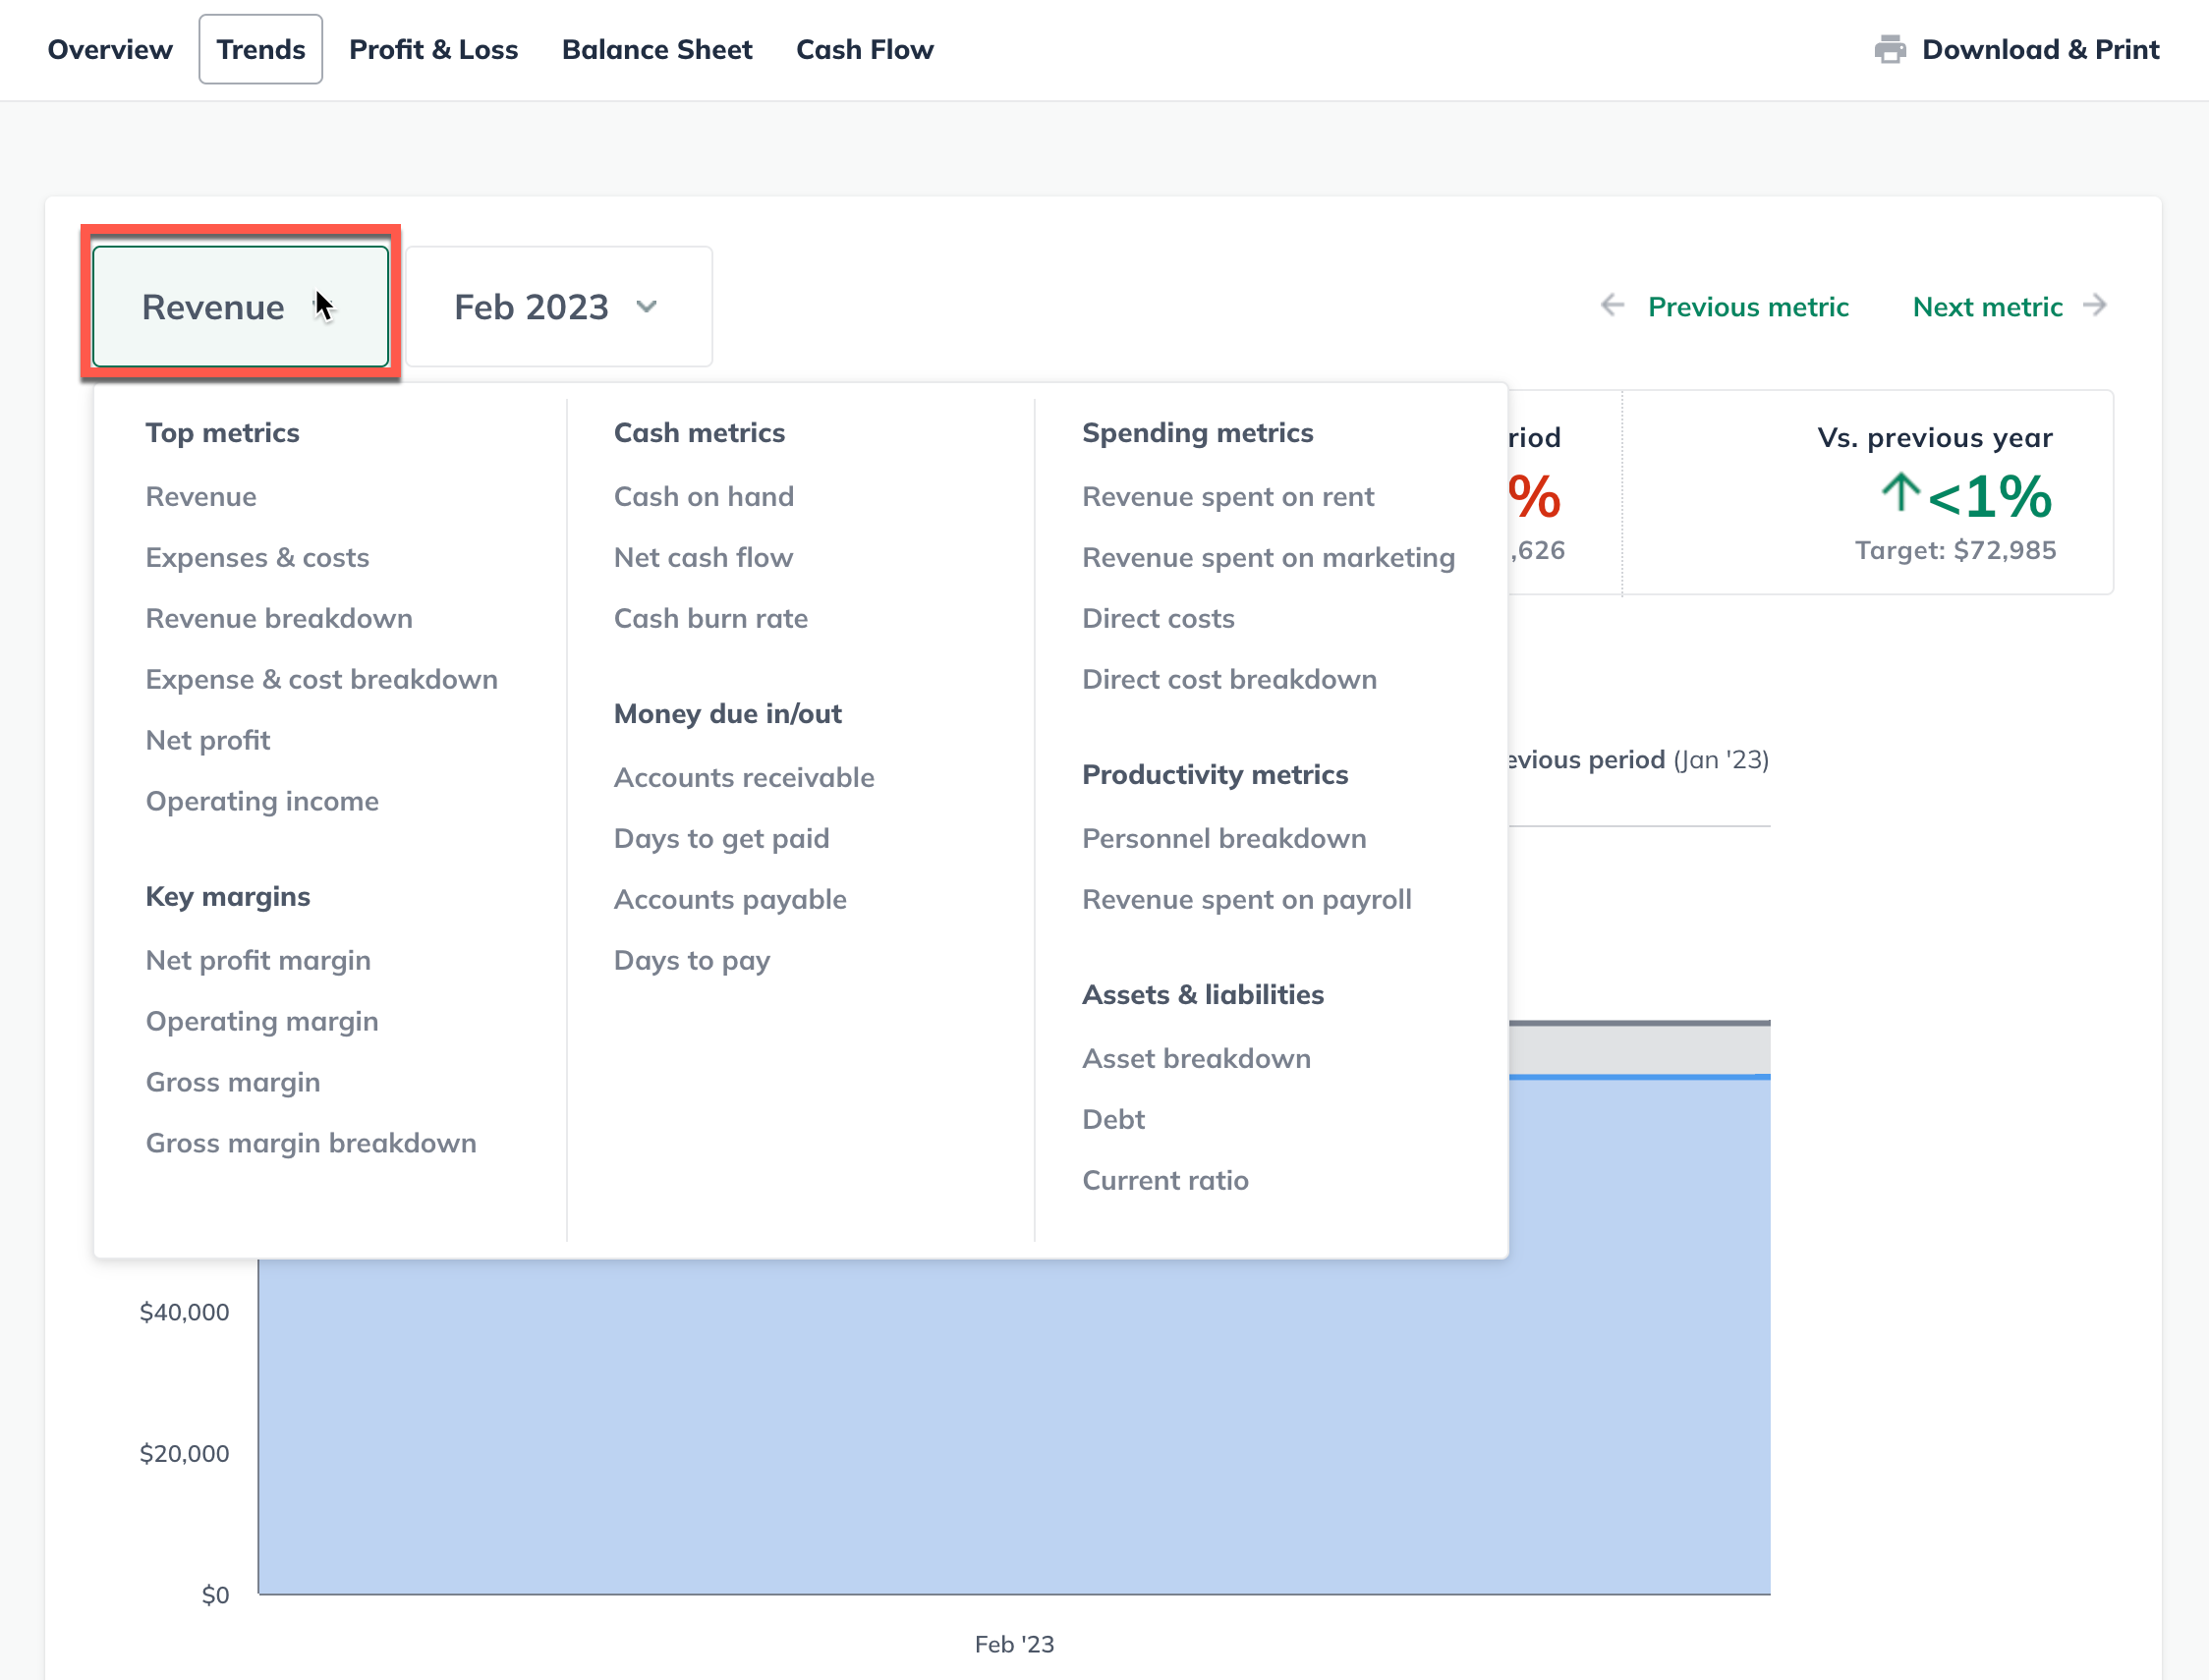
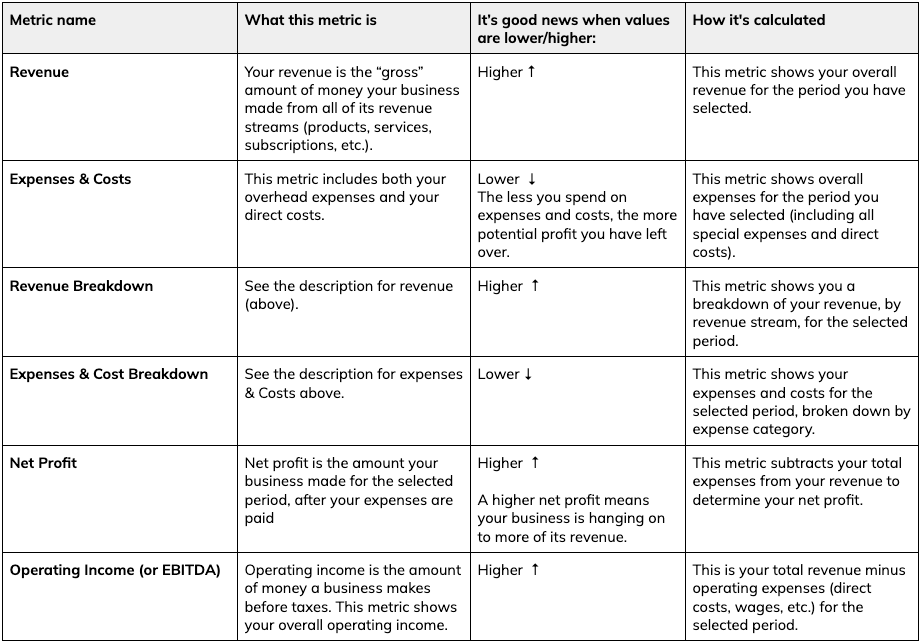
Top metrics
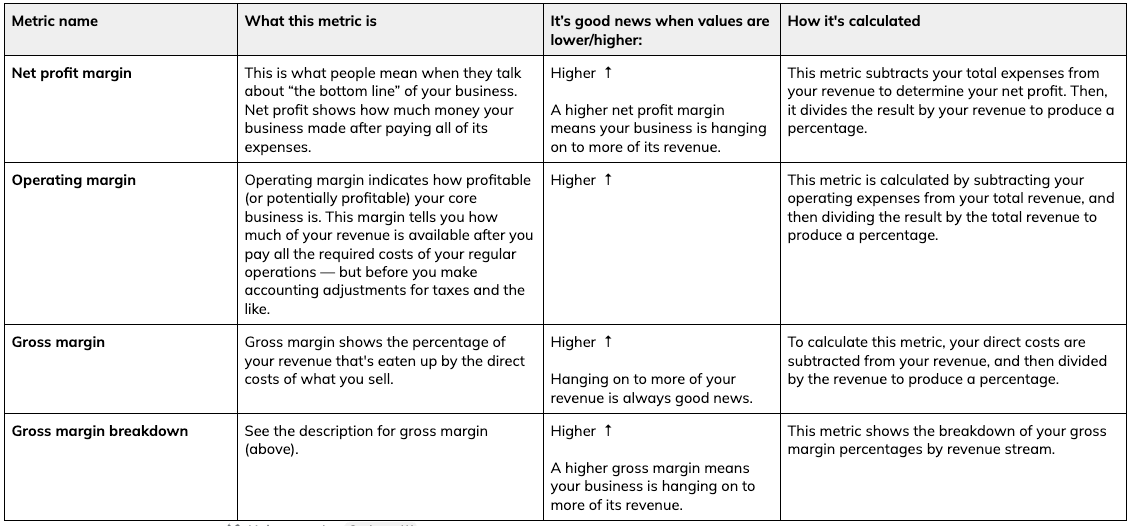
Key margins
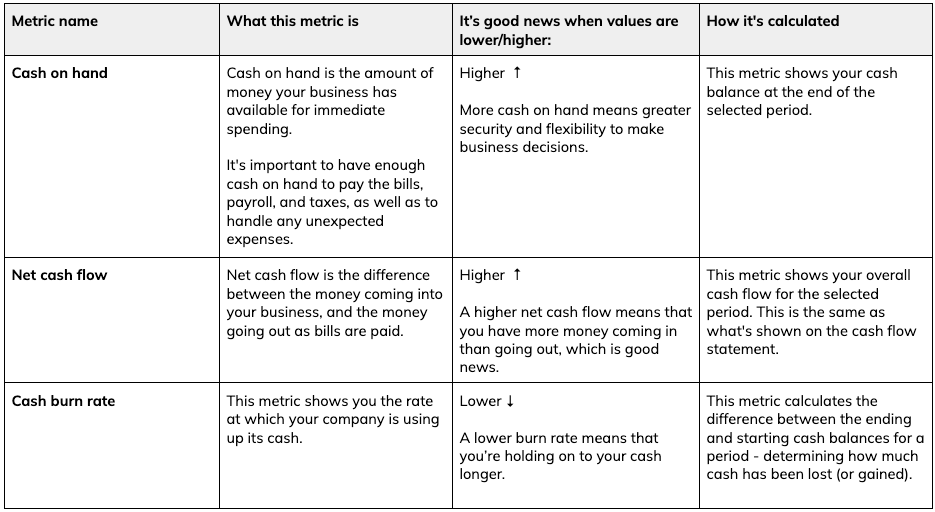
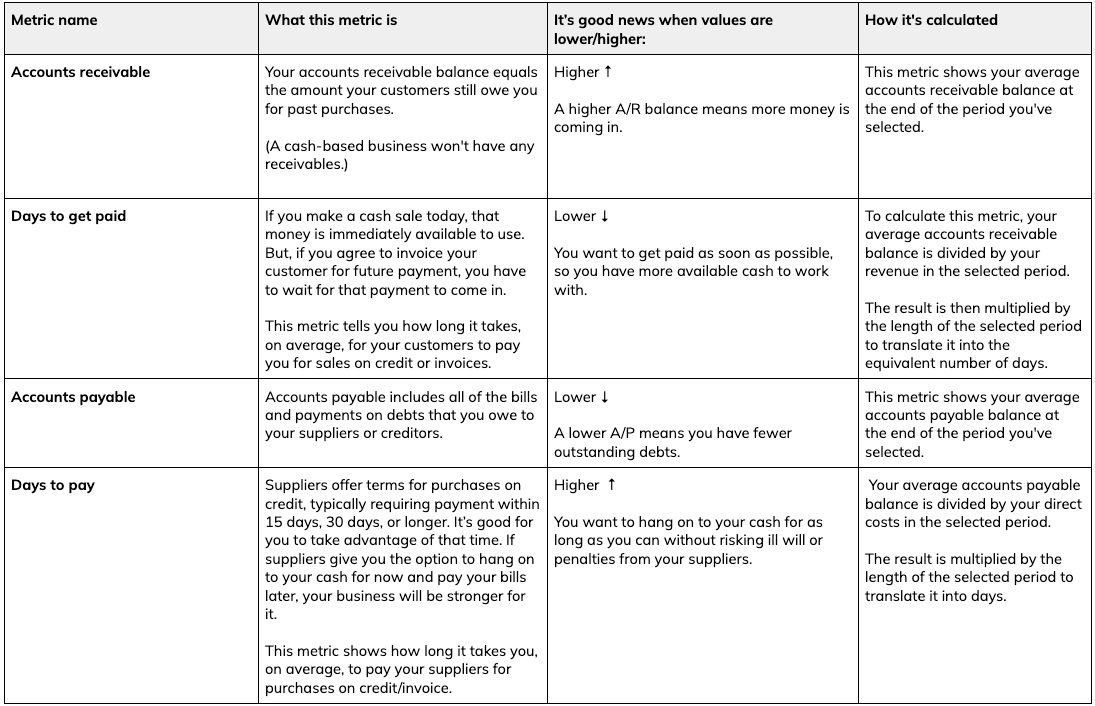
Cash metrics
Money due in/out
Spending metrics
The ratio of revenue that you spend on rent, marketing, and payroll for your company can tell you a lot about the health of your business. If you import actuals from your accounting solution into the Dashboard, you'll be able to access these metrics:
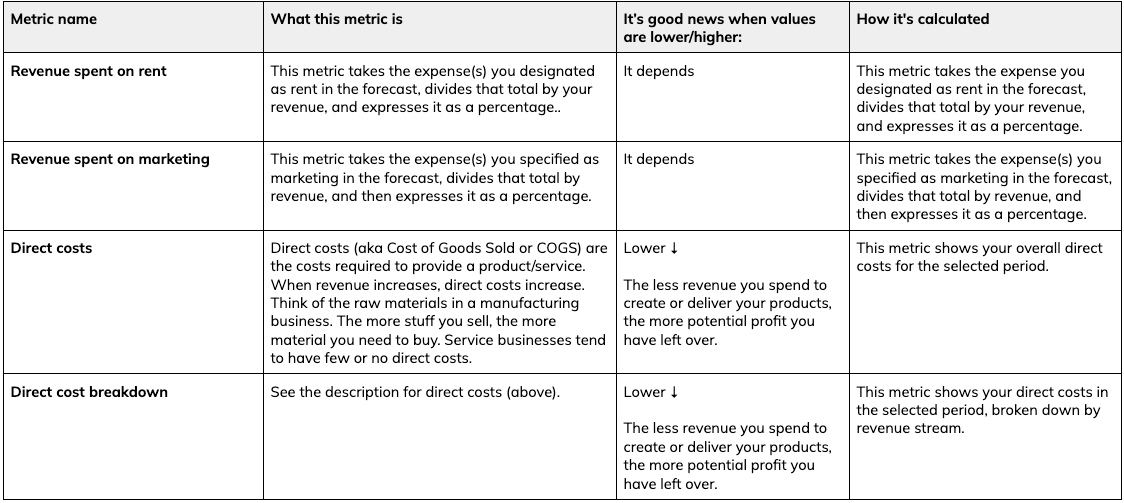
Revenue spent on rent
This metric helps you figure out how much of your company’s revenue to spend on rent for a workspace. Aiming for a lower percentage here may make it easier for your business to absorb fluctuating costs in other areas, such as inventory and personnel. But a low percentage doesn’t always mean you’re paying lower rent. A more expensive property can still have a low rent-to-revenue ratio, if its location brings more revenue to the business. For example, a storefront in a more expensive location may bring in more customer traffic and revenue. Keep in mind that the percentage of revenue companies spend on rent varies a great deal by industry and region. So, for this benchmark, it’s best to compare your company to those in the same industry and region. A good place to do that is in the Benchmarks section of LivePlan.
Revenue spent on marketing
This metric helps you estimate how much of your company’s revenue to spend on advertising, promotions, and other marketing activities to generate sales. The ideal amount to spend on marketing depends on several factors. If you can spend less on marketing and still generate the same revenue, then that’s typically the most efficient and profitable thing to do. However, if you spend less on marketing than your competition does, you run the risk of potential customers not knowing who you are. Also, revenue spent on marketing tends to be higher for smaller businesses and startups. More established and larger businesses tend to spend less revenue on marketing. This makes sense because startups often need to spend more on marketing to survive and grow compared to larger, more established companies.
Productivity metrics
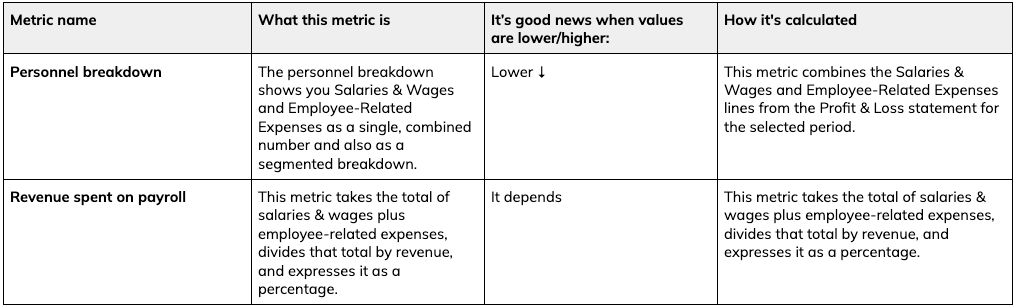
Revenue spent on payroll
This productivity metric helps you estimate how much of your company’s gross income to spend on payroll. For this metric, payroll includes salaries and wages for on-staff and contract employees, plus employee-related expenses (benefits, taxes, etc.). Spending too much of your revenue on personnel can result in your business being unprofitable. On the other hand, spending too little can make it difficult to attract and keep good employees. This metric can also tell you something about a company’s efficiency. If two similar companies generate the same revenue, but one does it with 30% fewer people, the more efficient company will clearly be more profitable.
Keep in mind that this percentage may vary quite a bit by industry. So, for this benchmark, it’s best to compare your company to those in the same industry, as in the Benchmark section. Your own actuals for this metric won't appear in the Benchmarks, however, because this data isn't available to LivePlan when you connect your accounting solution.
Assets & liabilities
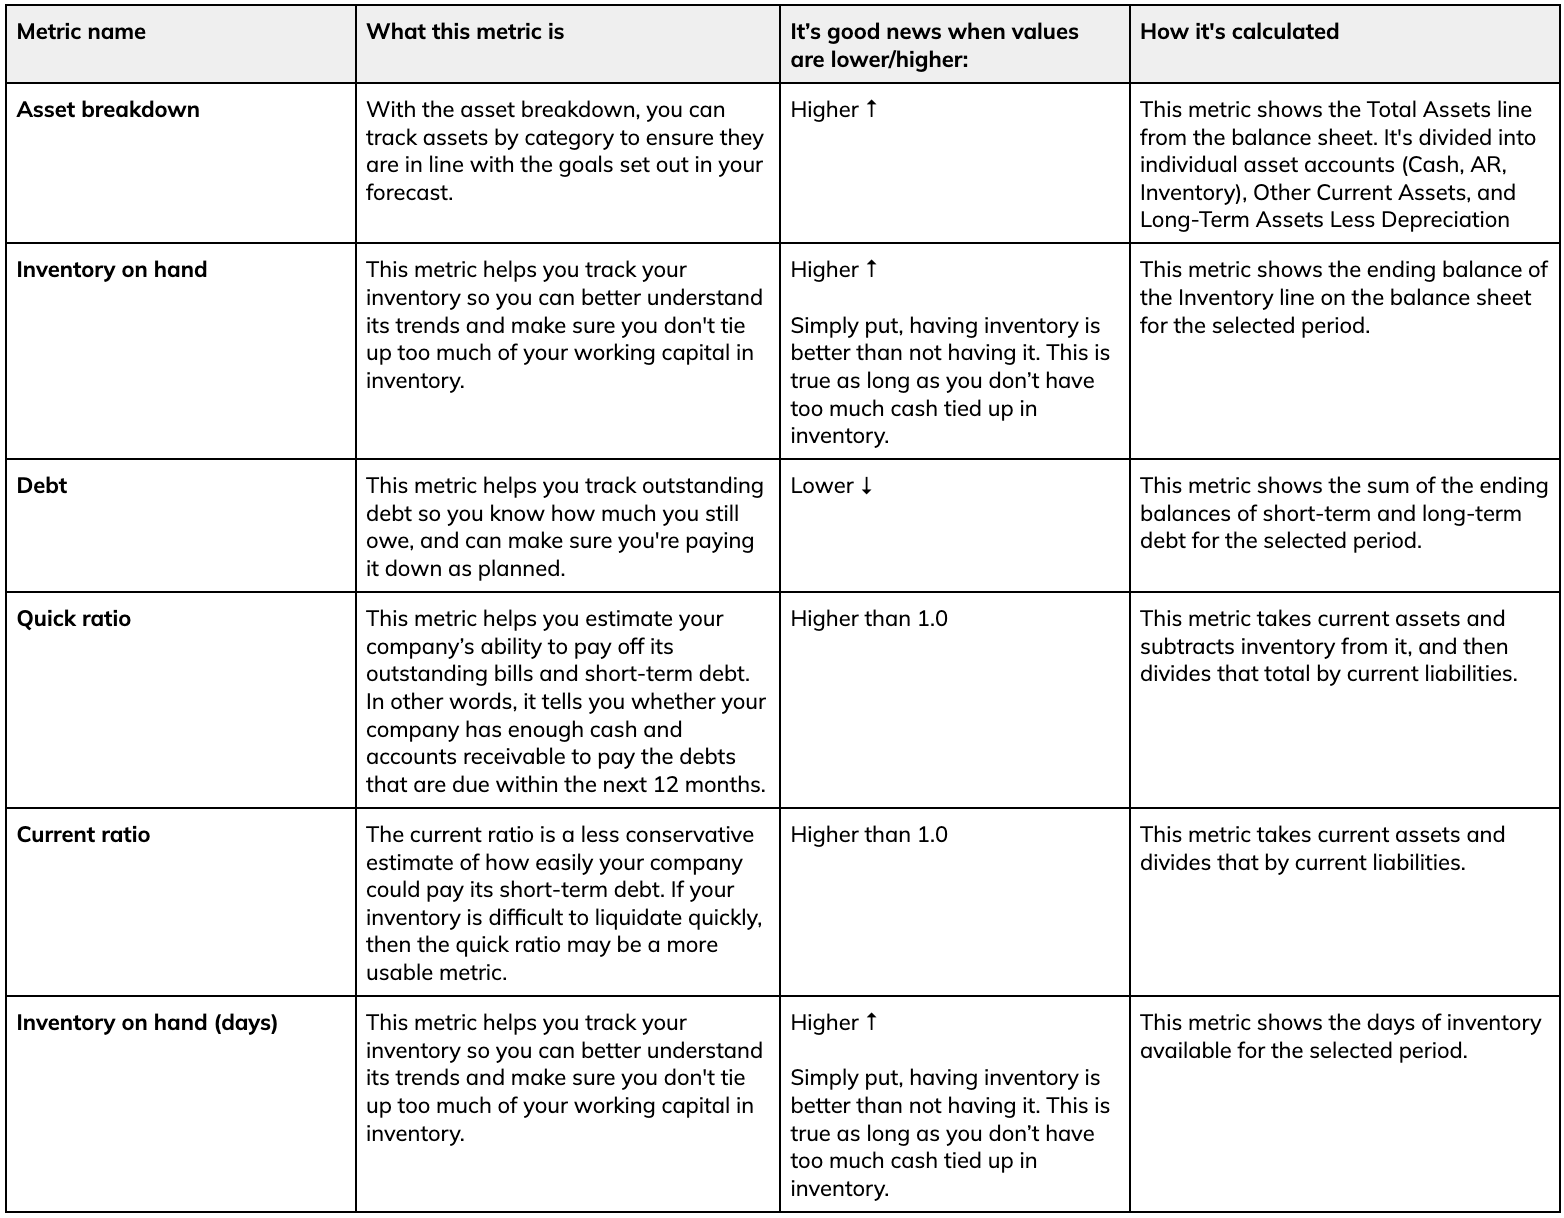
Quick Ratio
This metric helps you estimate your company’s ability to pay off its outstanding bills and short-term debt. In other words, it tells you whether your company has enough cash and accounts receivable to pay the debts that are due within the next 12 months.
Here are some examples of quick ratios:
A quick ratio of 1.0 indicates that a business has just enough cash available to pay off its short-term debts.
A company with a quick ratio of 2.0, on the other hand, has $2.00 of cash/liquid assets available to cover every $1.00 of current liabilities. A company in this situation has twice as much cash/liquid assets it needs to cover its short-term debt.
On the other end of the spectrum, a company with a quick ratio of .5 only has fifty cents to cover each $1.00 of its short-term debt. This ratio can spell disaster if the debts suddenly become due and payable.
Quick ratio is very similar to current ratio (below). However, the quick ratio doesn’t include inventory in the assets you could potentially use to pay off your debts - this is because inventory can be difficult to sell quickly for cash. As a result, the quick ratio is a more conservative estimate of how easily your company could pay off its short-term debts.
Current Ratio
Just like the quick ratio, the current ratio metric tells you if your company has enough cash and accounts receivable to pay debts that are due within the next 12 months.
As mentioned above, the current ratio also includes inventory as part of the liquid assets you could use to pay off short-term debt. The examples of quick ratio would be the same for the current ratio - a ratio of greater than 1.0 is the best-case scenario.
The current ratio is a less conservative estimate of how easily your company could pay its short-term debt. If your inventory is difficult to liquidate quickly, then the quick ratio may be a more usable metric.