
How LivePlan calculates the Debt Service Coverage Table
The debt service coverage table is an optional Plan component that shows whether your business earns enough operating income to cover its debt obligations.
For loans, LivePlan uses the principal and interest payments scheduled in your forecast. For lines of credit, there usually isn’t a fixed payment schedule to use, so LivePlan estimates one. The estimate is based on what it would cost to pay down the outstanding line of credit balance evenly over 5 years.
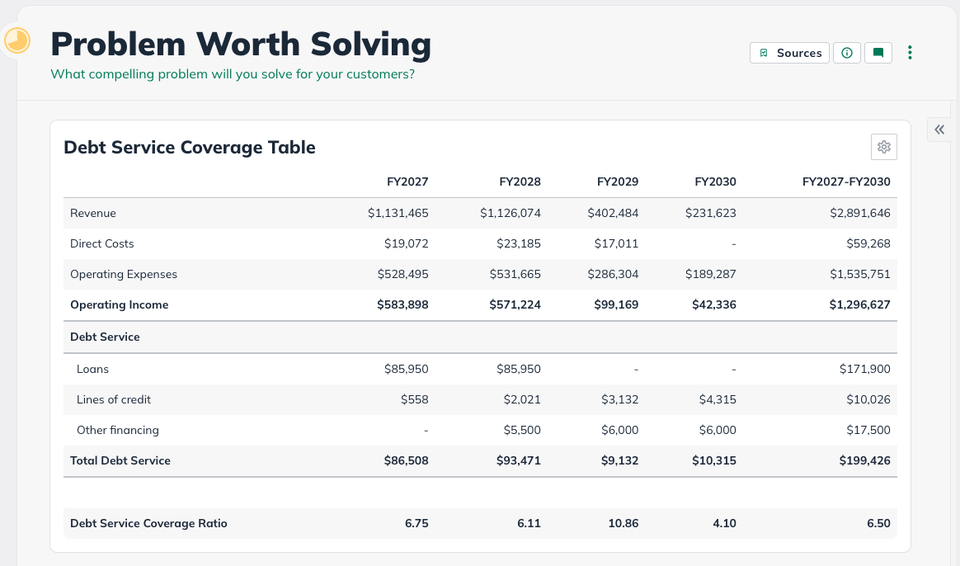
This means the line of credit amount in the table may not match what you’re actually paying or repaying day to day. That’s expected.
Frequently asked questions


It shows whether your business has enough operating income to cover its debt service.
The key number is the Debt Service Coverage Ratio, or DSCR:
Operating Income ÷ Total Debt Service
A ratio above 1.0 means operating income is higher than the debt service shown in the table.
A ratio below 1.0 means operating income is not enough to cover that debt service.
Loans have a payment schedule in your forecast, so LivePlan can use those scheduled principal and interest payments.
Lines of credit do not work the same way. You can draw from the line and repay it as cash flow allows, so there is no fixed monthly payment schedule for LivePlan to pull into the table.
LivePlan takes the outstanding line of credit balance and estimates what it would cost to pay that balance down evenly over 5 years.
This creates a consistent number for the debt service coverage table, but it is not an actual payment plan.
Because the table is showing a debt service estimate, not your real line of credit activity.
The line of credit row is meant to approximate how a lender may evaluate the balance for debt service coverage. To see your actual line of credit draws and repayments, use the financing area of your forecast and the balance sheet.
Many lenders evaluate a line of credit by estimating what repayment would look like over an assumed repayment period. LivePlan uses a 5-year estimate to show a reasonable lender-style view of the line of credit in the debt service coverage table.
Individual lenders may calculate debt service differently.
For dollar rows, the Overall column adds the years together.
For the DSCR row, LivePlan does not average the yearly ratios. Instead, it recalculates the ratio using total operating income divided by total debt service for the full period shown.
If the business has no loans, lines of credit, or other debt financing, the debt service rows and DSCR show a dash instead of a number. Other rows in the table still display normally.