Performance Tracking And Dashboard
Using LivePlan's Industry Data
NAICS codes and descriptions are updated every five years. Despite these updates, many of the NAICS industry titles still contain somewhat outdated terminology.
For example, if you are writing a business plan for a coffee shop, and you search for "coffee shop," NAICS will return a category called "Snack and Nonalcoholic Beverage Bars." This is the correct category for a coffee shop, but it might not seem intuitive based on the title. Likewise, if you search for "web design," NAICS will return a category called "Custom Computer Programming Services." Be sure to read the descriptions for each suggested industry and LivePlan Assistant's reasoning why it could be a good match for your business. Then, choose the one that most closely aligns with your business; you can always go back and select a different industry later.
When creating your company or adjusting your company type, LivePlan’s AI Assistant will automatically generate the industry code most closely aligned with your business’ industry. You can also manually search for your industry within the U.S. The benchmarks will then display metrics showing how companies similar to yours have performed in the past.
We have added some current terms as keywords for LivePlan's custom search algorithm to make locating the correct category for your business easier. But, if you have difficulty finding a NAICS category that seems correct for your business, please contact us, and we'll be happy to help you.
Finding your industry
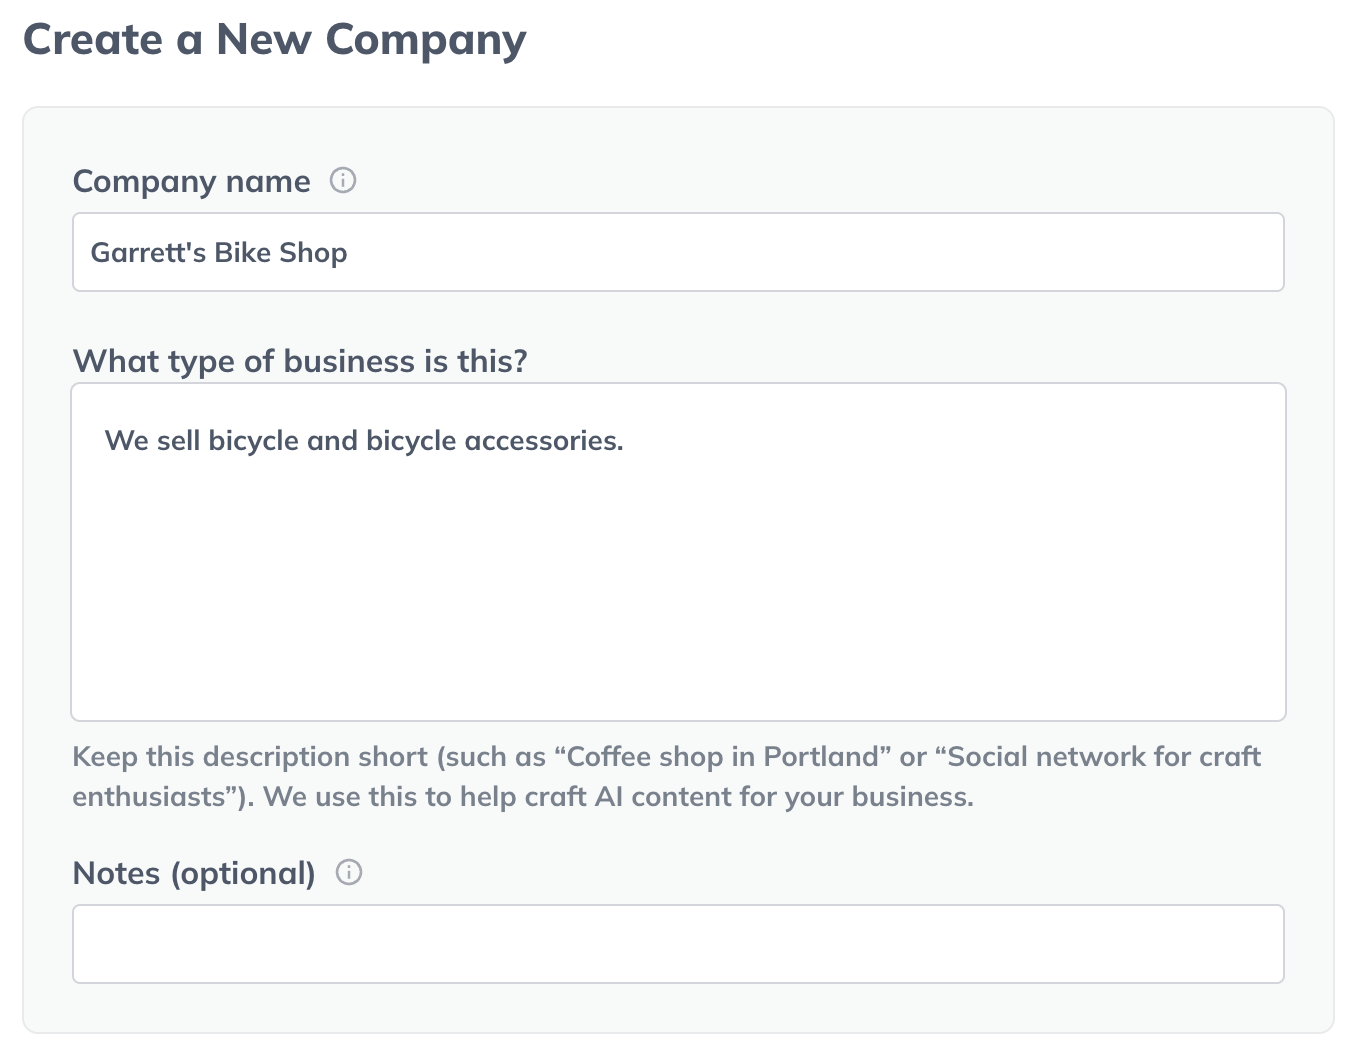
When you begin a new business plan, LivePlan will prompt you for your company name and a brief description of your business:
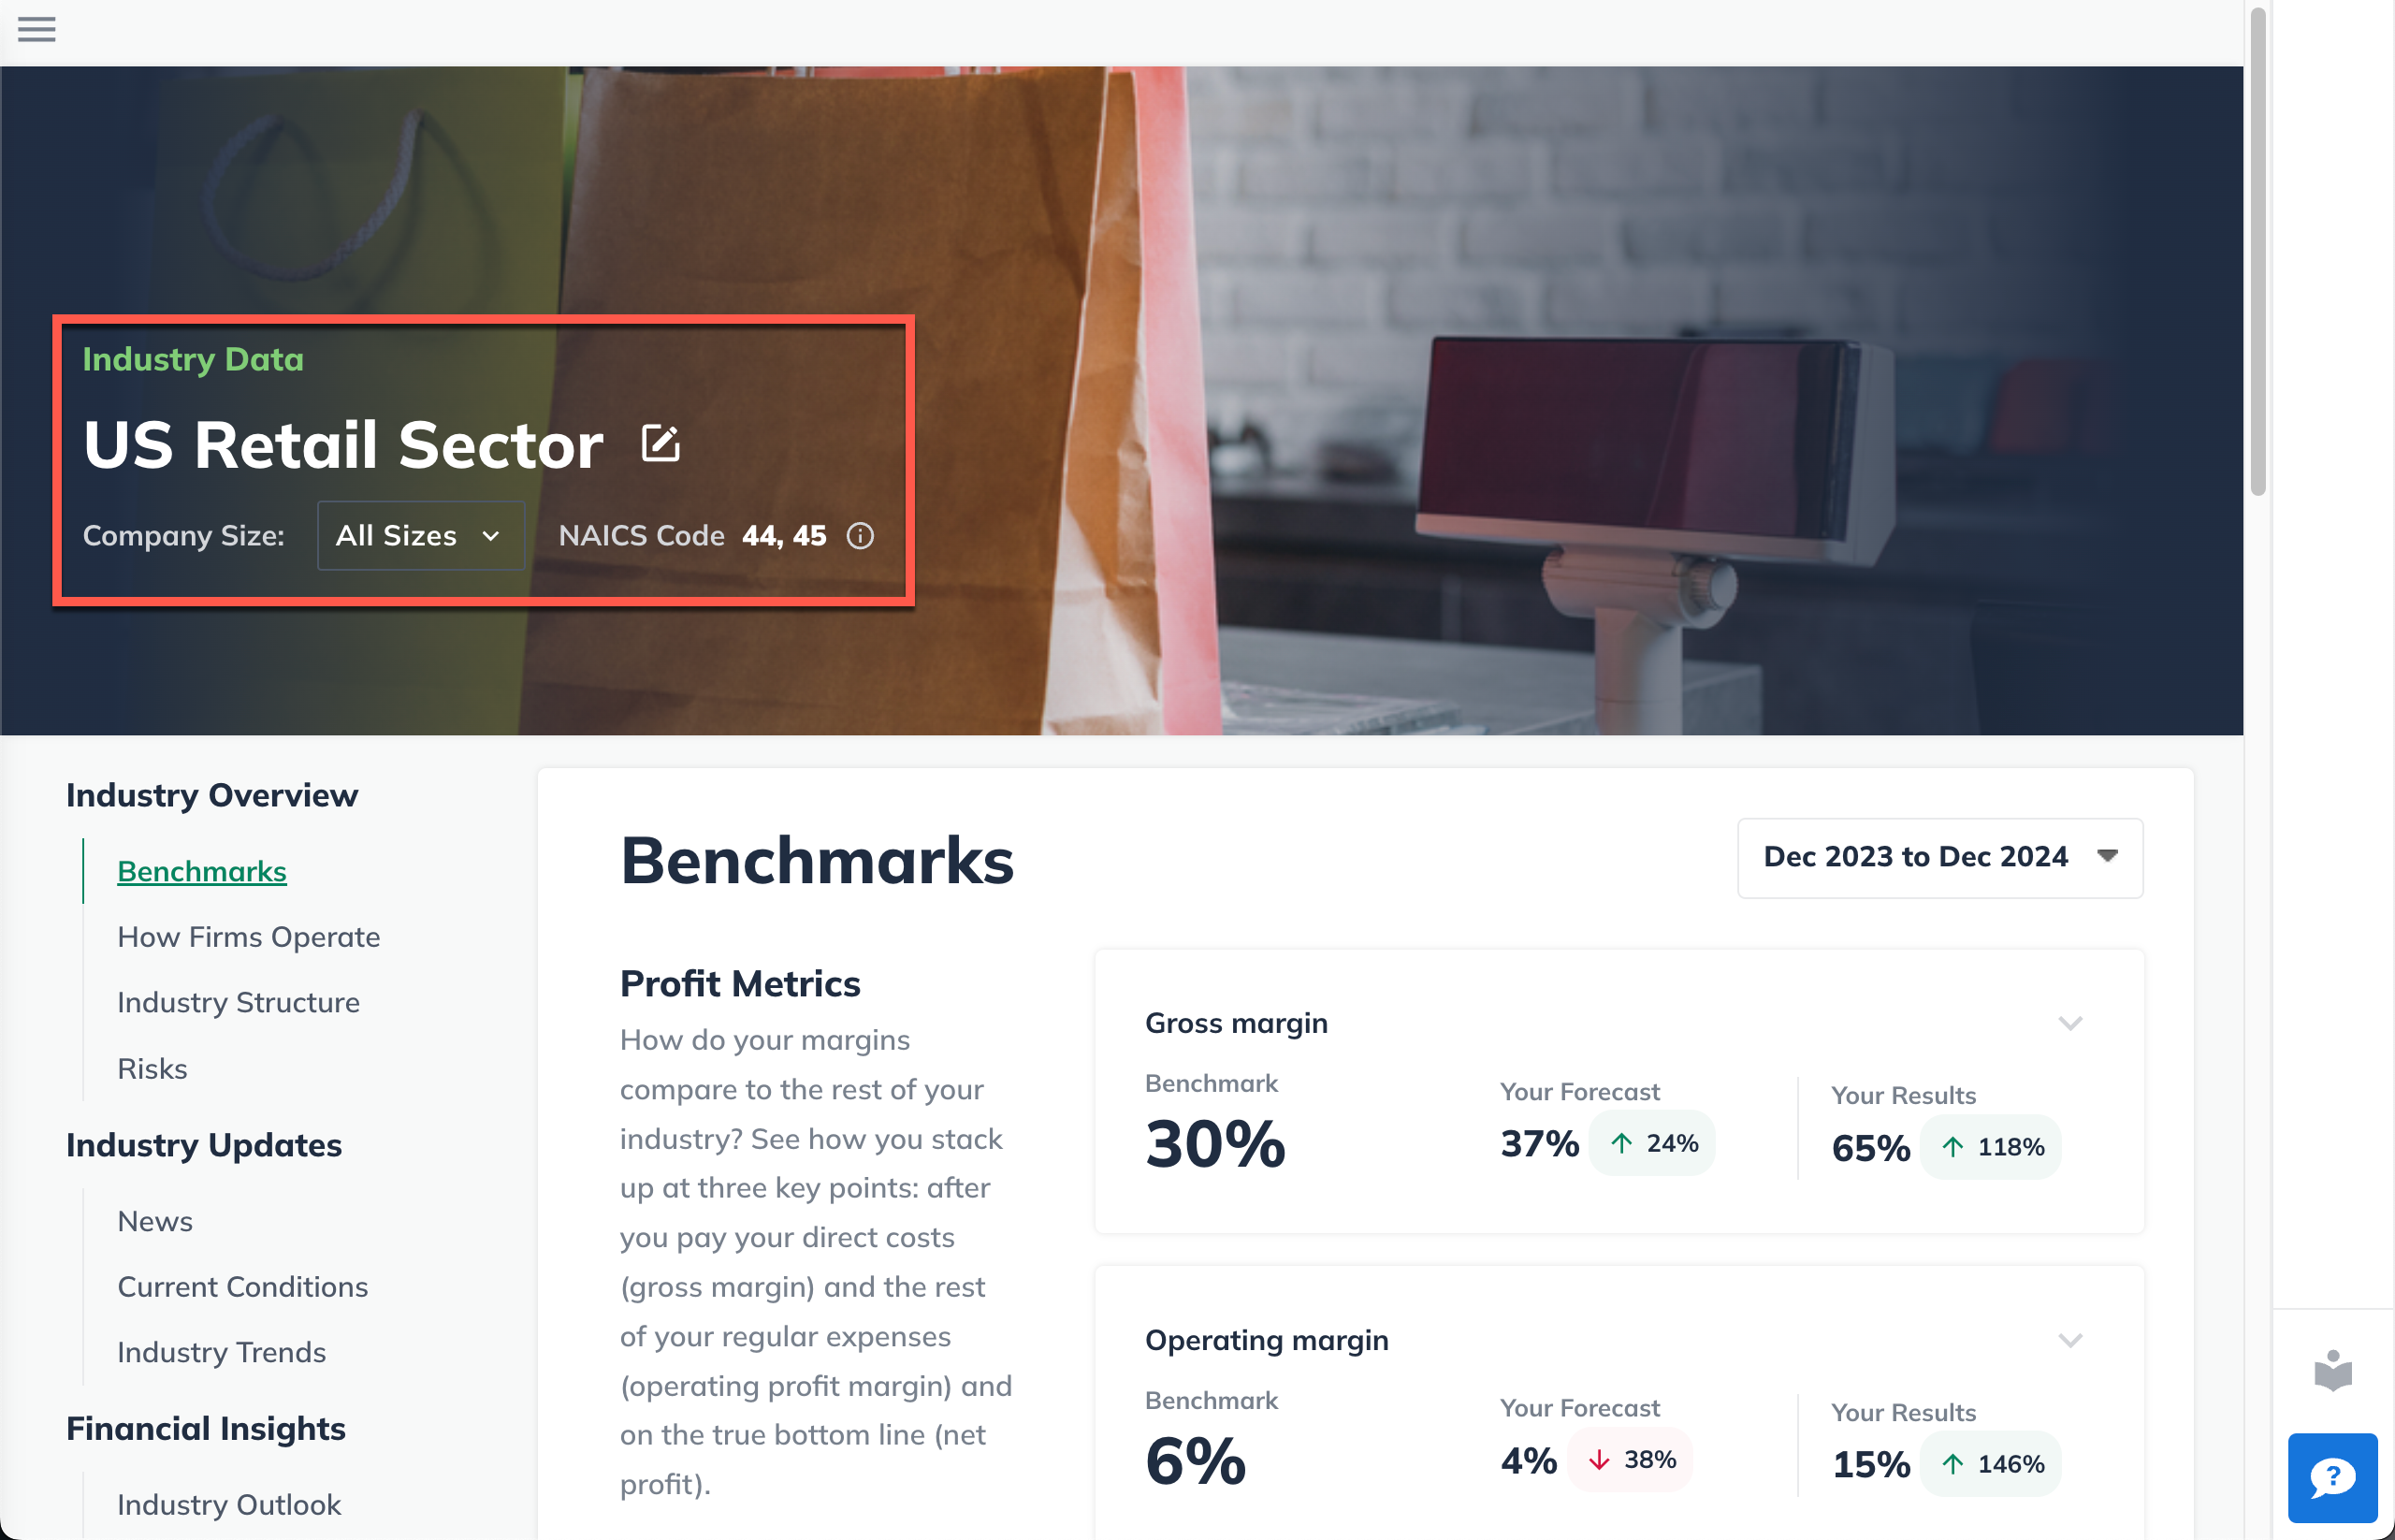
Then the LivePlan Assistant will pre-populate your benchmark sector based on your input:
Changing your industry
If you would like to change to a new industry, click the pencil icon next to your industry name and NAICS code near the top of the Benchmarks section:

When you open the Change Industry menu, the LivePlan Assistant will auto-generate suggestions for other industries based on your business name and the description under What type of business is this? in the Options menu:
If the Assistant's suggestions don't quite fit, you can enter the keyword(s) for your business in the industry search box, and click the green search button:
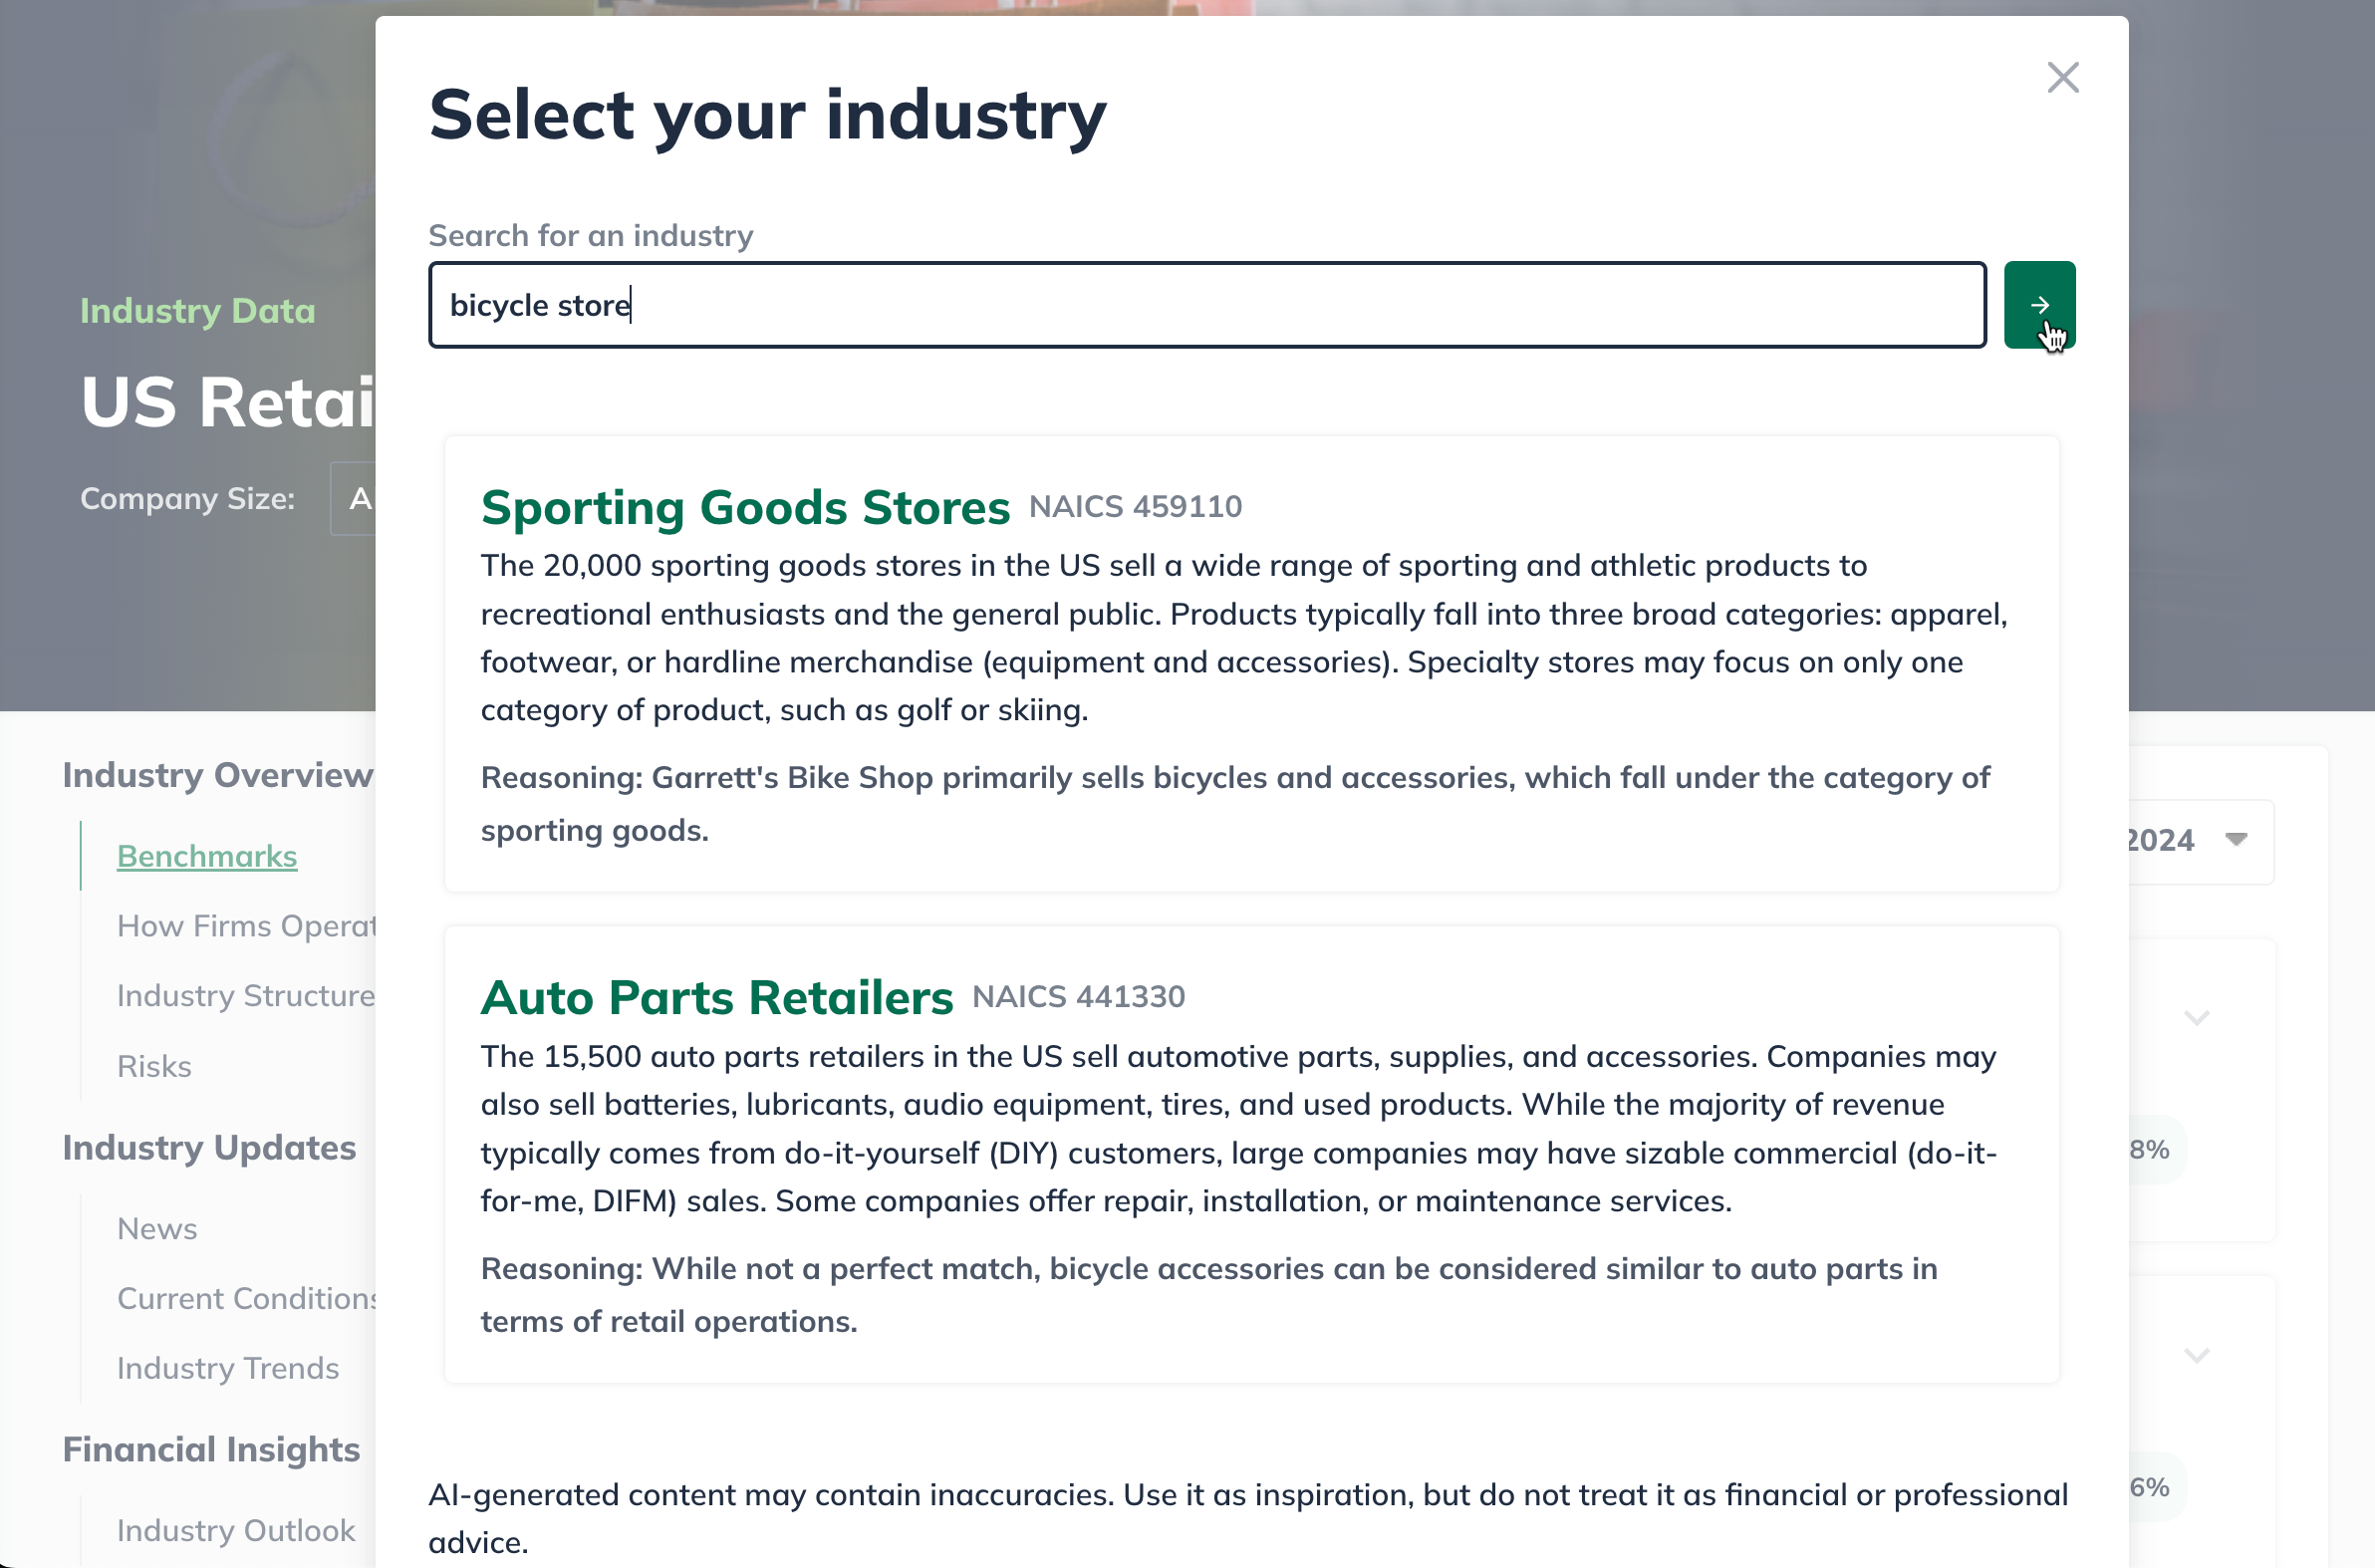
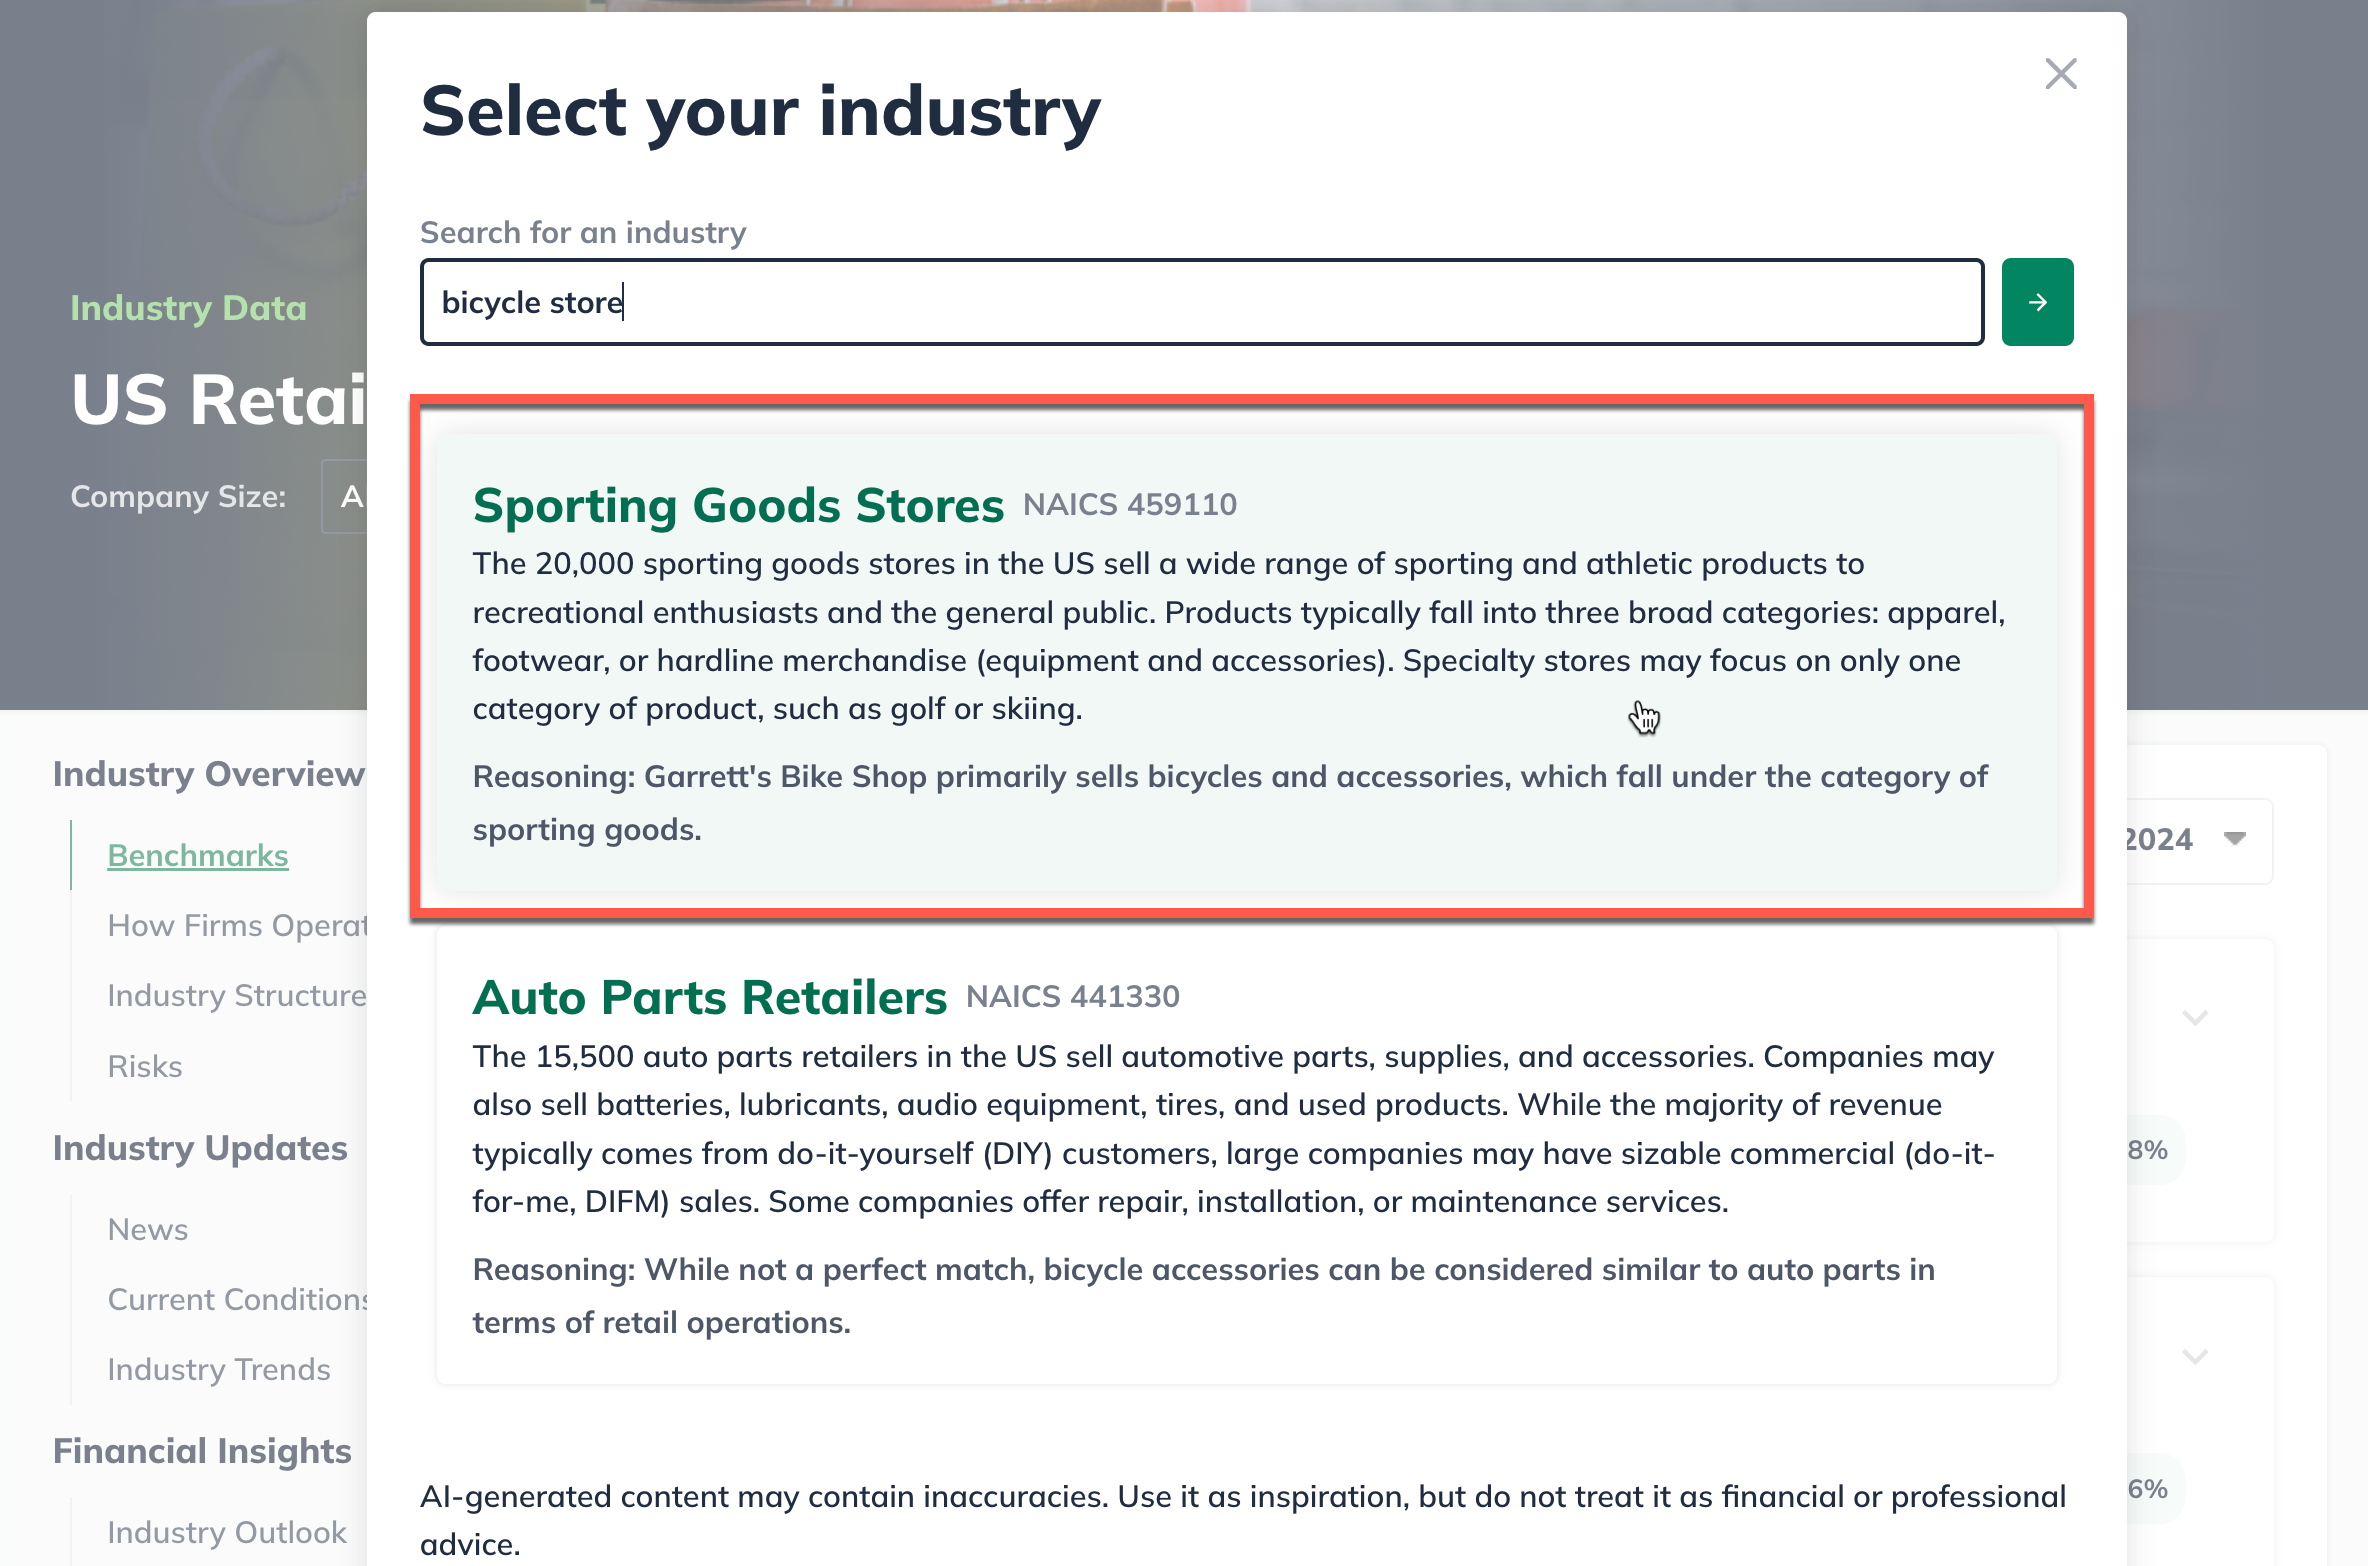
From the list of results, locate the industry category that most closely matches your business and click on it to select it as your industry:
Changing the company size
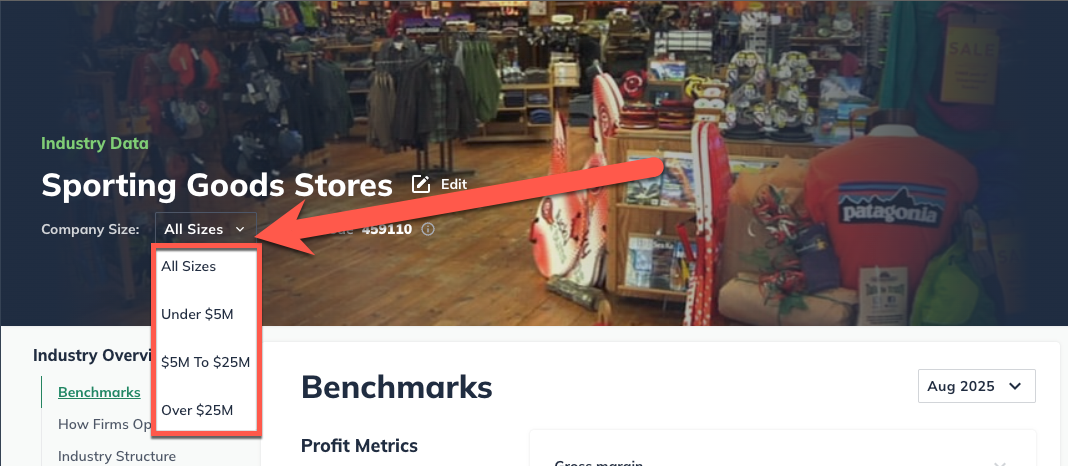
LivePlan automatically sets the company size to All sizes. However, you can change this setting at any time:
Click All sizes and select the range of annual revenue that you want to include in your industry benchmarks:
Changing the date range
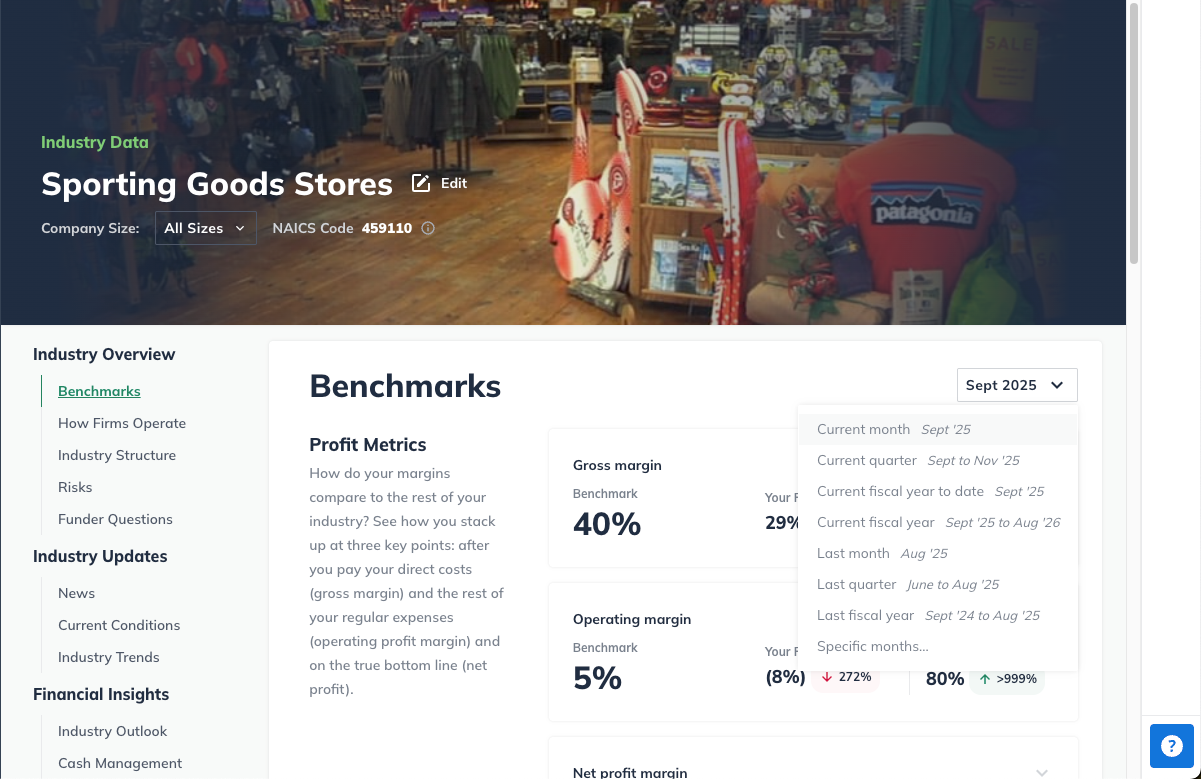
You can also view your benchmark data for different periods. This allows you to see larger data sets and see if your industry has any seasonal fluctuations.
Note: If you change the start date of your forecast, you'll also need to change the time frame of your Industry Data to match.
To access a different date range, use the pull-down menu in the right corner:
Viewing Industry Data Results
Once you set your industry in the Industry Data section, you’ll see a results summary like the one below. In this view, you can see industry averages for key profit, cash, & spending metrics, as well as current ratios:
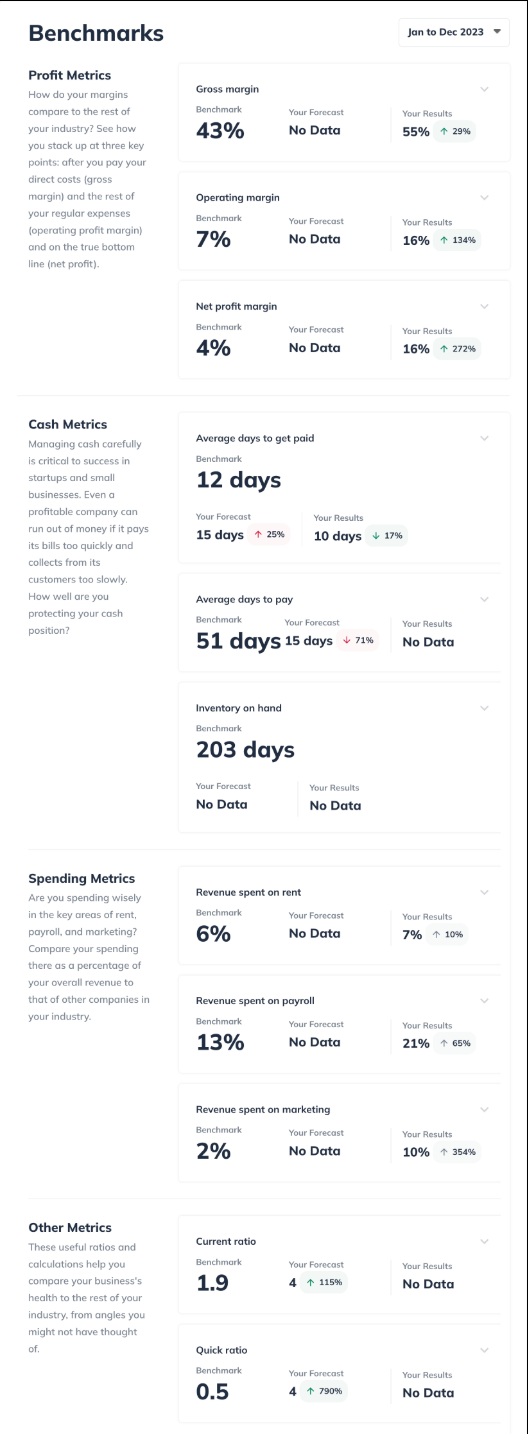
Note that you can see two sets of figures being compared to the Industry Data:
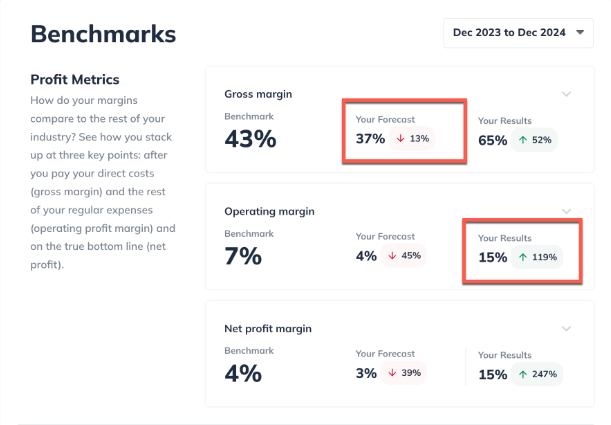
What does each metric mean?
From the metrics tables, you can click through for more details about any of the metrics. Click on the metric you wish to explore for more details.
This section provides detailed information on calculating the metric, interpreting the numbers, and its use in business forecasting.
For an overview of all available metrics, read About LivePlan’s Industry Data.
Frequently asked questions about benchmarks
How to use benchmarks if you are outside of the United States
The industry data from our partners at Vertical IQ comes from U.S. companies only. Over 30% of our customers are outside the U.S., and we have users in most countries worldwide. It would be great to offer everyone local benchmark data. While we continue to search for sources of international benchmark data, we haven't yet found any data sets with enough scope to be as helpful to our global customers as they are to our U.S. customers.
That being said, if you are in a country outside the U.S., these benchmarks may still be helpful in giving you a real-world sense of what metrics different businesses can expect.
Why can't I see my forecast data in the benchmarks section?
When you first set up your company and build your forecast, the Benchmarks display will default to the same start date you choose for your forecast, even if that start date is in the future.
If you change the start date of your forecast, however, then you may find that you see "No Data" in the Forecast column of the Benchmarks page, as shown below:
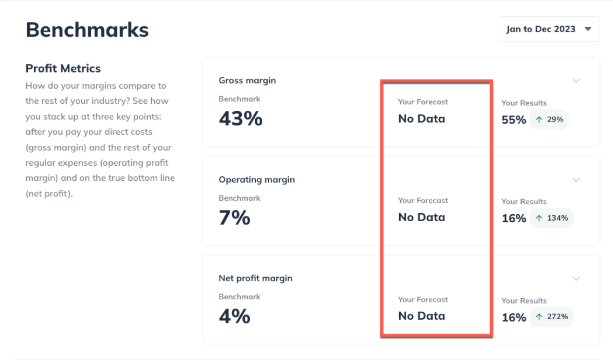
If this is the case, all you'll need to do is manually change the date range of your Industry Data display to match the new forecast's start date:
Locate the pull-down date selection menu. Select Specific months:
In the menu that appears, you can select a date range, as shown below. First, select year and month in the From field that will include any financial actuals data you'd like to see compared in the Industry Data. Then in the To field select an end date that will include at least some of your forecast timeline to see forecast data compared in the Industry Data as well. Then click Apply:
Note: If your business does not yet have actuals, set your From date to match the new starting date of your forecast.
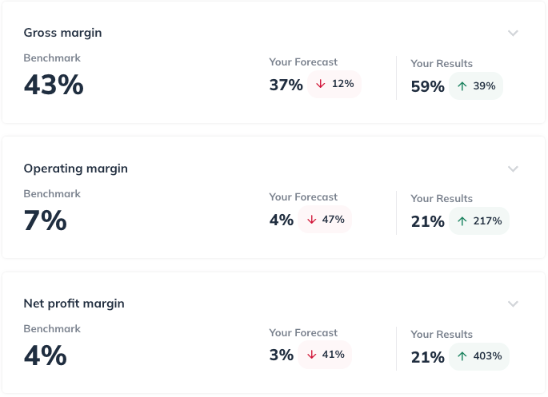
With that change of date range, you should now be able to see your forecast data in the Benchmarks display:
Why can't I see forecast values for revenue spent on rent or marketing?
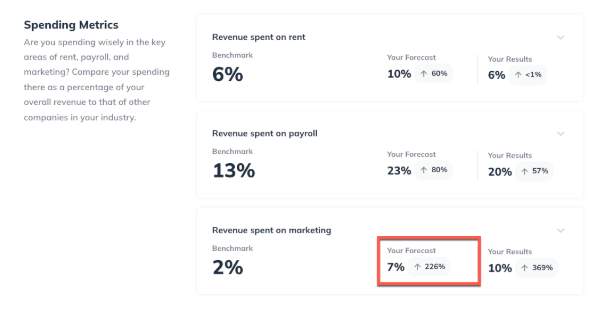
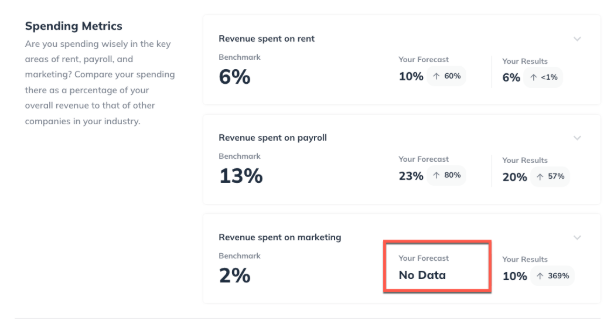
In the Industry Data section, under Spending Metrics, you may see No Data in the Your Forecast column, as shown below. This can happen in one of two ways:
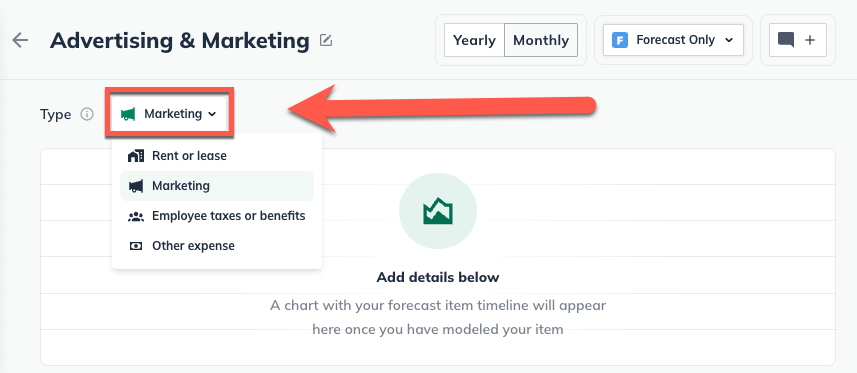
You haven't yet marked any of the Expense entries in your forecast as Rent or Marketing.
You've identified your rent or marketing expenses in the forecast but have not yet entered any numbers for them.
In order to calculate the forecast spending metrics, LivePlan needs to know which of the expenses in your forecast are rent and marketing expenses. To identify them in the forecast, follow these steps:
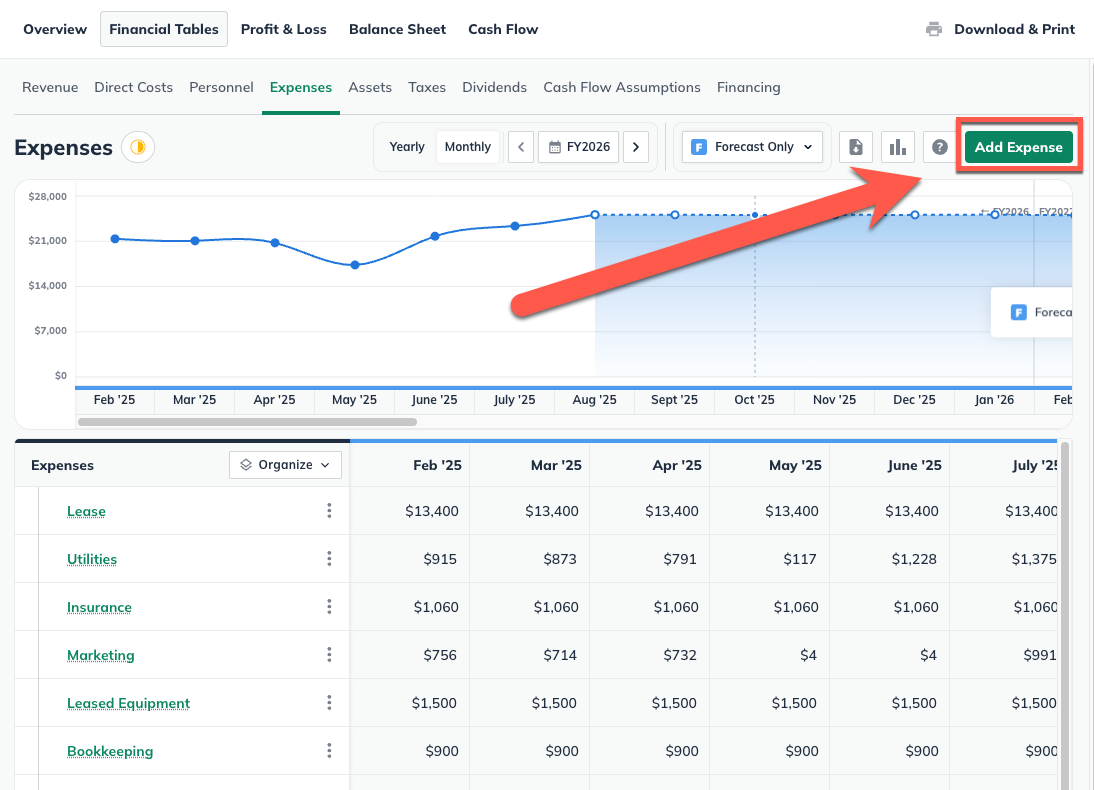
Click on the Forecast section and choose Expenses:

Click on an existing expense you have set up for marketing or rent (or create one if you haven't set it up yet):
In the overlay that appears under What sort of expense is this, select Marketing or Rent or lease:
Click Save & Exit:

Go back to the Benchmarks section in Industry Data, and your forecast value for Revenue spent on marketing will display:
